External dependence of Colombia as a resource-rich economy, an analysis from 2000 to 2021
Dependencia externa de Colombia como economía rica en recursos naturales, un análisis de 2000 hasta 2021
Medardo Alfonso Palomino-Arias**
*Economista, Universidad Santiago de Cali, Colombia. Magíster en Gestión Pública, Universidad Santiago de Cali, Colombia. Profesor Tiempo Completo en la Corporación Universitaria Minuto de Dios – UNIMINUTO, Santiago de Cali, Colombia. Miembro del grupo de investigación CONEXIÓN. Correo electrónico: medardoalfonsopalomino@gmail.com
Fecha de recepción: 03 de abril de 2025
Fecha de aceptación: 02 de junio de 2025
Fecha de publicación: 30 de junio de 2025
Palomino-Arias, M. A. (2025).External dependence of Colombia as a resource-rich economy, an analysis from 2000 to 2021s. Revista Criterio Libre, 23 (42). https://doi.org/10.18041/1900-0642/criteriolibre.2025v23n42.11835
Abstract
This article presents evidence of the external constraints faced by Colombia as a developing economy, focusing on the behavior of investment, net exports, and the exchange rate from 2000-2021. Stylized facts of the Colombian economy and economic theory are used to present an outlook of its external dependence. The analysis reveals that the export of primary goods is significantly influenced by international prices, while increases in investment raise imports and expert pressure on the exchange rate. These findings enhance our understanding of Colombia's foreign exchange constraints and its technological reliance in the twenty-first century.
Keywords
Investment in machinery and equipment, technological dependence, imports, capital goods.
Clasificación JEL
F43 E22, F1
Resumen
Este artículo muestra evidencia sobre la restricción externa que Colombia enfrentó como país en vías de desarrollo, examinando el desempeño de la inversión, las exportaciones netas y la tasa de cambio en el periodo comprendido entre el 2000 al 2021. Hechos estilizados de la economía colombiana y la teoría económica son usados para presentar una perspectiva de su dependencia externa. El análisis muestra que las exportaciones de bienes primarios son altamente dependientes de los precios internacionales y la inversión tiró hacía arriba las importaciones y presionó sobre la tasa de cambio. Estos hallazgos contribuyen al entendimiento de la restricción de la tasa de cambio de Colombia y su dependencia tecnológica in el siglo XXI.
Palabras clave
Inversión en maquinaria y equipo, dependencia tecnológica, importaciones, bienes de capital.
JEL Clasification
F43 E22, F1
1. Introducción
The economics literature widely acknowledges the importance of capital formation for long-run economic growth. This relationship is commonly attributed to the increase in output per worker that physical capital facilitates through investments in structures and the accumulation of tools, machinery, and equipment tailored to the needs of the workforce. These ideas were first postulated by Smith (2002) and later reaffirmed by neoclassical economists as Harrod (1939) and Domar (1946).
Estimates for 1950-2016 indicate that non-ICT (Information and Communication Technology) was the main contributor to GDP growth in developed economies, including the United States, the United Kingdom, France, as well as East Asian nations such as Japan, Singapore, South Korea, and China. In Latin America, countries such as Chile, Argentina, Mexico, and Colombia also witnessed capital (non-ICT capital) as the primary contributor togrowth in labour productivity (The Conference Board, 2023). Cardenas (2005) specifically estimated that the capital/output ratio was the major contributor to labour productivity in Colombia from the 1990s through 2004. However, it has been widely argued that physical capital embodies technology, making it difficult to distinguish the respective contributions of physical capital and technology to productivity growth can be challenging (Fagerberg, 1994).
Historically, Colombia has experienced low investment rates, with a declining trend from the 1950s to the early years of the 21st century (Table 1). Apart from the period between 1950 and 1959, the data shows that Colombia's investment rates have been significantly lower than those that propelled East Asian economies out of poverty.
Broadly speaking, Colombia, along with other Latin American countries, can be somewhat compared to East Asian nations. These East Asian economies started from similar levels of poverty in the 1960s but achieved vigorous and sustained economic growth rates that raised their incomes to the levels of industrialized countries (Feenstra et al., 2015). Moreover, Colombia can also be compared to resource-rich developed countries that experienced growth and development through land-based primary-product industries (Martínez Ortíz & Ocampo, 2011). However, Colombia has lagged in investment performance compared to some East Asian countries and resource-rich developed economies. Notably, investment rates in those countries have consistently surpassed 30%, and countries such as Japan, China, and South Korea started from lower rates than Colombia. As the East Asian countries approached the Western standard of living in terms of per capita income, their investment rates gradually slowed (e.g., Japan, South Korea). Remarkably, China and Singapore achieved peak investment rates of 47% and 55%, respectively.
Table 1. Investment Rates by Decade (%GDP)
| Period | Colombia | Australia | Finland | Sweden | China | Japan | R. Korea | Singapore |
|---|---|---|---|---|---|---|---|---|
| 1950-1959 | 28.3% | 33.5% | 36.4% | 28.7% | 17.7% | 19.0% | 13.9% | N.D |
| 1960-1969 | 24.7% | 32.8% | 38.8% | 32.9% | 16.9% | 31.3% | 19.2% | 38.7% |
| 1970-1979 | 23.6% | 29.2% | 40.1% | 31.5% | 18.4% | 39.6% | 29.6% | 54.0% |
| 1980-1989 | 22.1% | 30.0% | 36.0% | 29.3% | 22.6% | 34.5% | 34.1% | 55.4% |
| 1990-1999 | 21.5% | 26.2% | 29.4% | 28.1% | 27.4% | 34.1% | 42.5% | 54.1% |
| 2000-2009 | 19.9% | 28.2% | 27.1% | 24.7% | 35.1% | 27.3% | 35.7% | 33.1% |
| 2010-2019 | 18.2% | 25.1% | 27.6% | 28.1% | 44.9% | 24.1% | 34.1% | 33.5% |
| Average | 22.6% | 29.3% | 33.6% | 29.0% | 26.1% | 30.0% | 29.9% | 44.8% |
Source: Table realized with data from Feenstra et al.(Feenstra et al., 2015). Data for China is disposable from 1952.
Mahalanobis (1953) demonstrated in his simple but illustrative model of economic growth that the investment-to-GDP ratio is as important as the allocation of investment, particularly whether resources should be directed to capital-goods or consumption-goods industries. Prebisch (1973) highlighted the dilemma for Latin American countries of choosing between investing in export industries or internal-market industries. Historical experience also underscores the importance of allocation. For example, the rapid growth of East Asian economies in the 1980s, surpassing Latin America, was fueled by investments in manufacturing and high-tech sectors, where industrial policy played a significant role in the development process (Chang, 2010; Garay et al., 1998; Kagami, 1995; Lall & Teubal, 1998). Long-term development, as summarized by Chang (Chang, 2007), requires investment in physical and human capacities, with a key role played by public provision. Additionally, their growth formula was not only based on high investment rates but also on the expansion of high-tech exports. The success of countries like Finland, Sweden, and Singapore in climbing the technological ladder and excelling in the external sector further illustrates the importance of these factors (Blomström et al., 2002).
The case of Latin American countries has been different in investment and the export performance relative to East Asian countries (Feenstra et al., 2015). During the period of import- substitution industrialization (ISI), one of the problems faced by Latin American countries was the weakness of the external sector, a matter acknowledged by ECLAC (Bielschowsky, 2009) and Prebisch (1988) who emphasized the need to stimulate exports.
In the case of Colombia, the low integration of its output into international markets resulted in significant balance-of-payments imbalances, and the lack of foreign exchange hindered the continuity of the industrialization process. Poveda Ramos (1997) emphasized the importance of export diversification and the negative consequences of overreliance on primary-goods specialization. Based on historical arguments and machinery and equipment data, Ortiz Quevedo & Vásquez Castro (2007) highlight Colombia's dependence on foreign technology and the crucial role of manufacturing in economic development. Likewise, Ortiz et al. (Ortiz et al., 2009) link Colombia’s high technological dependence to low economic growth, as the country has lost manufacturing capacity and relies on natural resources-based commodities.
The lack of foreign exchange has been a recurrent problem in the Colombian economy (García-García et al., 2020). Reforms were implemented from the mid-1970s to promote exports as a strategy for economic development (Riveros, 1984). In the 1990s, market reforms were carried out to remove the anti-export bias and spur the external sector of the economy, following the principle of comparative advantage (Documento CONPES 2465, 1990; Documento CONPES 2494, 1994) and reducing protectionism (GRECO, 2004). Consequently, the country has specialized in land-based primary products that have defined its most recent exports.
Palma (2019) addresses the international division of labor, stating that resource-poor economies finance their deficits in raw materials by exporting manufactured goods, while resource-rich economies finance their deficits in manufacturing by exporting land-based primary products. On the other hand, Bradford de Long & Summers, 1991, 1992) found a positive correlation between investment in machinery and equipment and economic growth, advocating for policies that allow the import of such manufactured capital goods in developing countries. This raises the question: What happens when a resource-rich economy cannot finance its import demand due to a drop in world prices for raw materials? As argued by Thirlwall (2012, p. 308), for many poor countries “foreign exchange is a major constraint” on their growth performance, and “with improved export performance and a lower income elasticity of demand for imports they would grow faster”. Underlying this argument is the need to finance imports with exports; and, since the growth depends on domestic income growth (GDP), an economy with an external imbalance must either allow its exchange rate to depreciate or adjust income to reduce imports—implying a slowdown or halt in growth. Thirlwall (2012) builds upon Prebisch's ideas of progress through manufacturing as a path to development, as opposed to specialization in primary products. According to Thirlwall (1979), export demand is crucial in an open economy.
The question then becomes why does demand grow at different rates between countries? One explanation may be the inability of economic agents, particularly governments, to expand demand. This explanation by itself, however, is not very satisfactory. The more probable explanation lies in constraints on demand. In an open economy, the dominant constraint is the balance of payments (Thirlwall, 1979, p. 329)
Although Colombia is classified as an upper-middle-income country per the World Bank’s classification (Fantom, 2016), it is a resource-rich economy with a significant reliance on mining in its total exports, as discussed below. This article aims to contribute stylized facts about Colombia’s economy in the 21st-century and uses them to argue for the country’s external dependence as a technology-dependent economy. The focus is on the period from 2000-2021, during which Colombia faced foreign exchange constraints due to its investment demand for capital goods and the decline in its international reserves following the end of the resource boom. To do this, a quantitative and descriptive methodological framework is employed, drawing upon various data sources, namely the National Administrative Department of Statistics (DANE), the Banco de la República (Colombia’s central bank), the Observatory of Economic Complexity, Penn World Table 10.0, ECLAC, and BP Statistical Review of World Energy. This period (2000–2021) was chosen not only because of data availability but also because it encompasses the resource boom, its subsequent downturn, fluctuations in investment levels, and provides insights into Colombia’s dependency on primary product activities—such as oil and coal— thereby strengthening the case for industrial policy.
The structure of the article is as follows. This introduction presents the theoretical framework of the work. In section two, we identify the drivers of the economy during 2000-2021 by comparing the growth of each component of aggregate demand with GDP growth rates. Section three analyzes investment and imports by breaking down imports by type. Section four focuses on the external sector, examining the performance of Colombia's exports, foreign capital inflow, foreign exchange, and international reserves. Finally, the article concludes.
2. The Colombia’s economic growth drivers
This selection process, including the inclusion and exclusion criteria, as well as the details of articles selected for analysis, is summarized in (Figure 1). The methodology for making corrections, coding and downloading the database was supported by the use of Rayyan software, which facilitated the review of author names— often written in different formats—and the review of abstracts to assess the relevance of each document. Followed by a final process of data cleaning in Excel for subsequent analysis in combination with the use of pivot tables and the use of VOSviewer.
Table 2. Economic Growth of Colombia in National Currency
| Year | Real GDP in Colombian pesos base year 2015 | GDP growth rates |
|---|---|---|
| 2000 | 284761 | N.D |
| 2001 | 289539 | 1.7% |
| 2002 | 296789 | 2.5% |
| 2003 | 308418 | 3.9% |
| 2004 | 324866 | 5.3% |
| 2005 | 340156 | 4.7% |
| 2006 | 362938 | 6.7% |
| 2007 | 387983 | 6.9% |
| 2008 | 401744 | 3.5% |
| 2009 | 408379 | 1.7% |
| 2010 | 424599 | 4.0% |
| 2011 | 452578 | 6.6% |
| 2012 | 470880 | 4.0% |
| 2013 | 493831 | 4.9% |
| 2014 | 515528 | 4.4% |
| 2015 | 531262 | 3.1% |
| 2016 | 542116 | 2.0% |
| 2017 | 549485 | 1.4% |
| 2018 | 563576 | 2.6% |
| 2019 | 581536 | 3.2% |
| 2020 | 540549 | -7.0% |
| 2021 | 597648 | 10.6% |
Source: Own calculations with data from DANE (DANE, 2024).
Three notable features of the Colombian economy can be highlighted. The first is that the investment and imports –unlike consumption, public spending, and exports –grew faster than the overall economy during the period analyzed, as shown by their evolution relative to GDP.
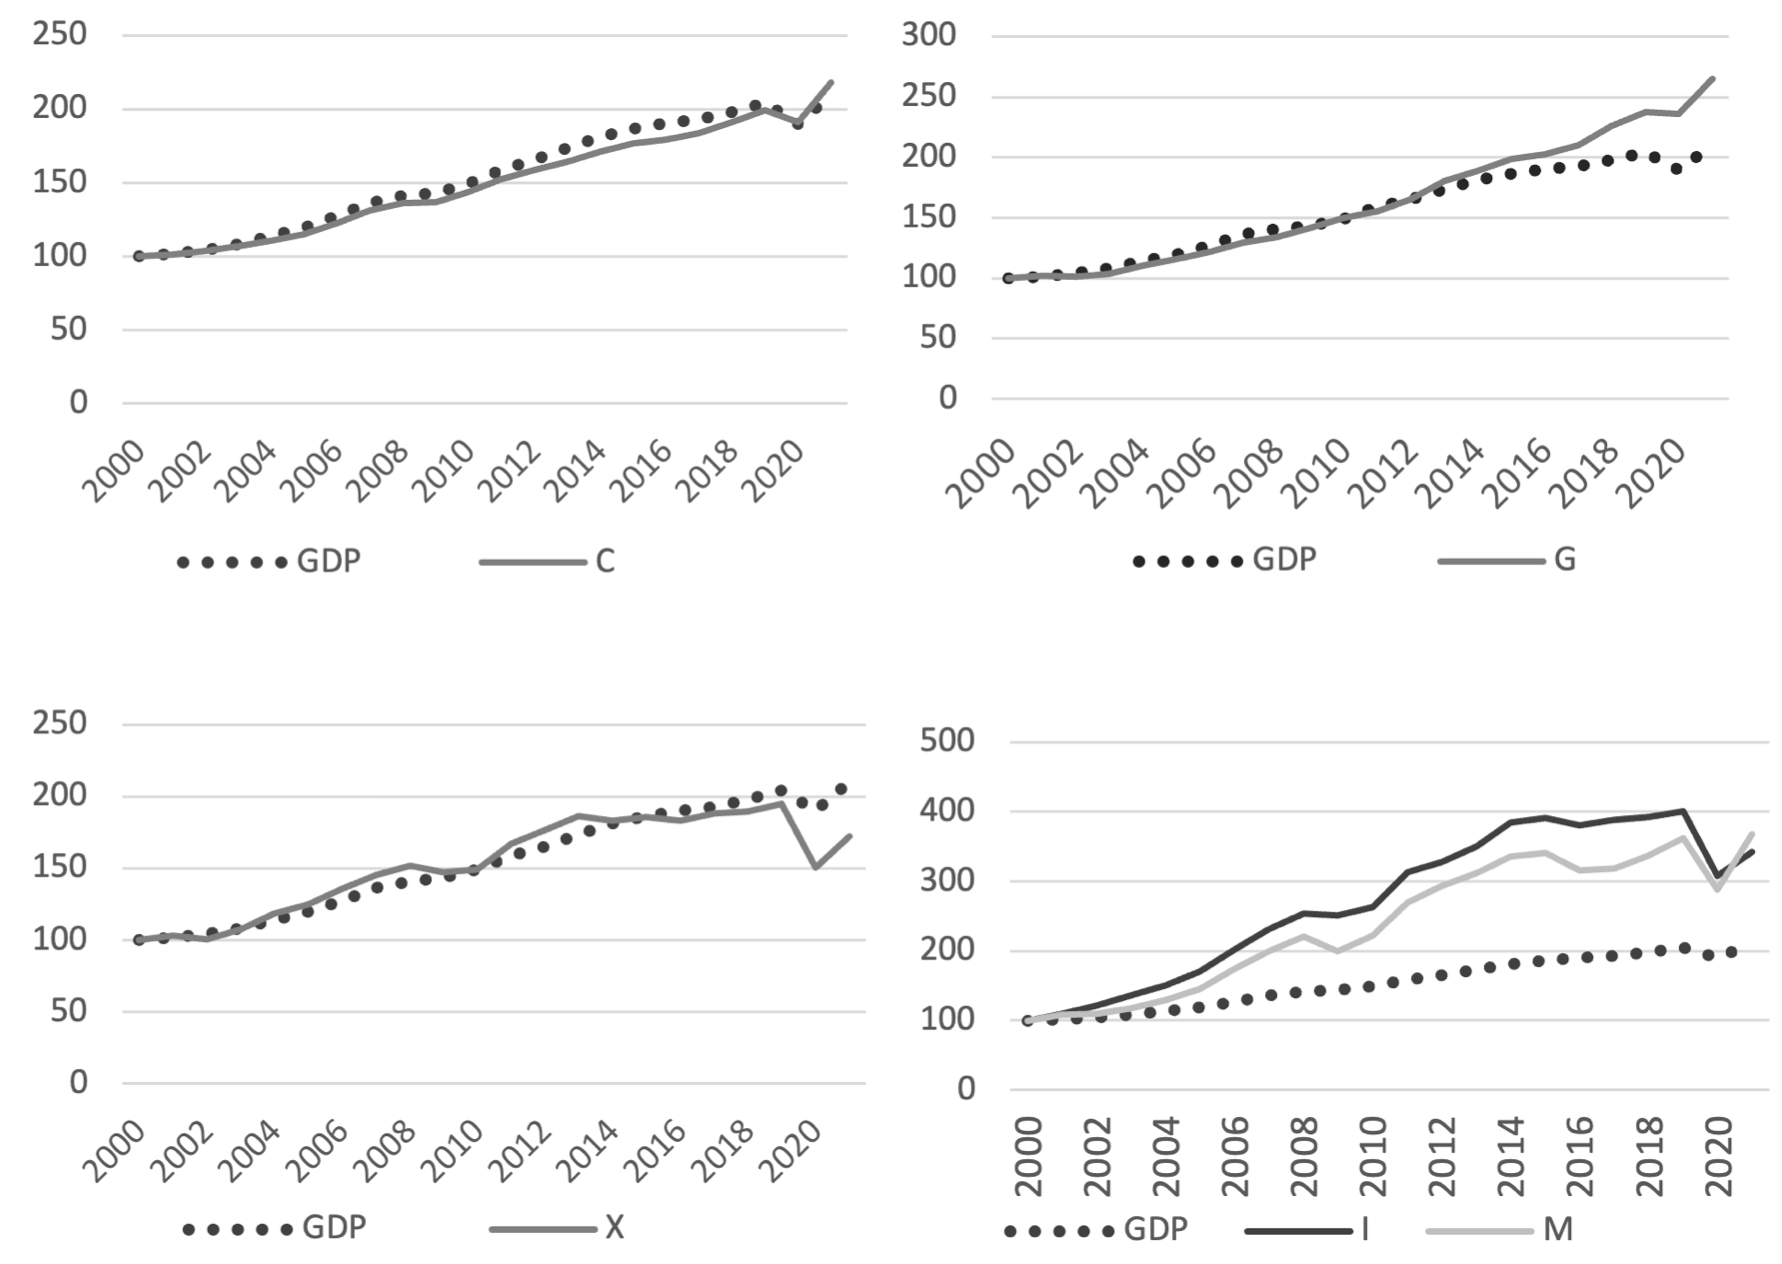
Figure 1. Real GDP performance and its components
Source: Own calculations with data from DANE (2024).
The second remarkable feature is the volatility of investment: in 2006 it peaked, in 2009 it fell to negative figures during the world financial crisis, then recovered, reaching a new peak in 2011, before slowing and dropping to negative figures in 2016. Investment remained weak until 2020, when the COVID-19 pandemic struck and pulled down investment along with every component of the economy. In 2021, GDP rebounded following the recession; however, investment was the demand component most affected by the pandemic, as evidenced by a substantial decline of 23.3% in 2020 and a relatively weak recovery of 11.2% compared with other demand components.
Table 3. Growth of GDP and its Components
| Year | GDP | Consumption | Investment | Public Spending | Exports | Imports |
|---|---|---|---|---|---|---|
| 2000 | N.D | N.D | N.D | N.D | N.D | N.D |
| 2001 | 1.7% | 1.6% | 9.7% | 2.2% | 2.8% | 8.7% |
| 2002 | 2.5% | 2.0% | 11.1% | -0.6% | -2.4% | 0.3% |
| 2003 | 3.9% | 3.0% | 11.5% | 1.8% | 7.4% | 8.2% |
| 2004 | 5.3% | 3.9% | 11.1% | 6.4% | 9.8% | 10.3% |
| 2005 | 4.7% | 4.0% | 13.2% | 5.2% | 5.7% | 11.9% |
| 2006 | 6.7% | 6.4% | 18.1% | 5.5% | 8.6% | 20.0% |
| 2007 | 6.9% | 7.3% | 14.4% | 6.1% | 6.9% | 14.0% |
| 2008 | 3.5% | 3.5% | 9.9% | 3.2% | 4.5% | 10.5% |
| 2009 | 1.7% | 0.6% | -1.3% | 6.0% | -2.8% | -9.1% |
| 2010 | 4.0% | 5.0% | 4.9% | 5.6% | 1.3% | 10.8% |
| 2011 | 6.6% | 6.0% | 19.0% | 3.5% | 11.8% | 21.5% |
| 2012 | 4.0% | 4.4% | 4.7% | 6.4% | 6.0% | 9.1% |
| 2013 | 4.9% | 3.4% | 6.8% | 9.3% | 5.2% | 6.0% |
| 2014 | 4.4% | 4.3% | 9.8% | 4.8% | -1.5% | 7.9% |
| 2015 | 3.1% | 3.2% | 1.8% | 4.9% | 1.2% | 1.4% |
| 2016 | 2.0% | 1.5% | -2.7% | 2.3% | -1.2% | -7.3% |
| 2017 | 1.4% | 2.3% | 1.9% | 3.6% | 2.6% | 1.0% |
| 2018 | 2.6% | 4.0% | 1.0% | 7.4% | 0.6% | 5.8% |
| 2019 | 3.2% | 4.3% | 2.2% | 5.3% | 3.1% | 7.3% |
| 2020 | -7.0% | -4.2% | -23.3% | -0.6% | -22.7% | -20.5% |
| 2021 | 10.6% | 14.1% | 11.2% | 12.1% | 14.2% | 27.5% |
Source: Own calculations with data from DANE (Dirección de Síntesis y Cuentas Nacionales).
Lastly, the third notable feature is the pronounced disequilibrium in the external sector of the Colombian economy, characterized by a disparity between the share and pace of exports relative to imports, resulting in a significant external imbalance. Export performance has played a subordinate role in the Colombian economy, with growth showing inconsistency and registering negative figures in five years during the period analysed. Moreover, peak export growth rates have been considerably lower than those of imports. For instance, in 2011 and 2021, exports reached a peak growth rates of 11.8% and 14.2%, respectively, significantly lagging the corresponding import growth rates of 21.5% and 27.5%. This gap underscores the challenges faced by Colombia in achieving a more balanced external trade relationship. Figure 2 provides a visual representation of this phenomenon, illustrating how investment has exerted an upward pull on the economy, while net exports have had a counteracting downward effect.
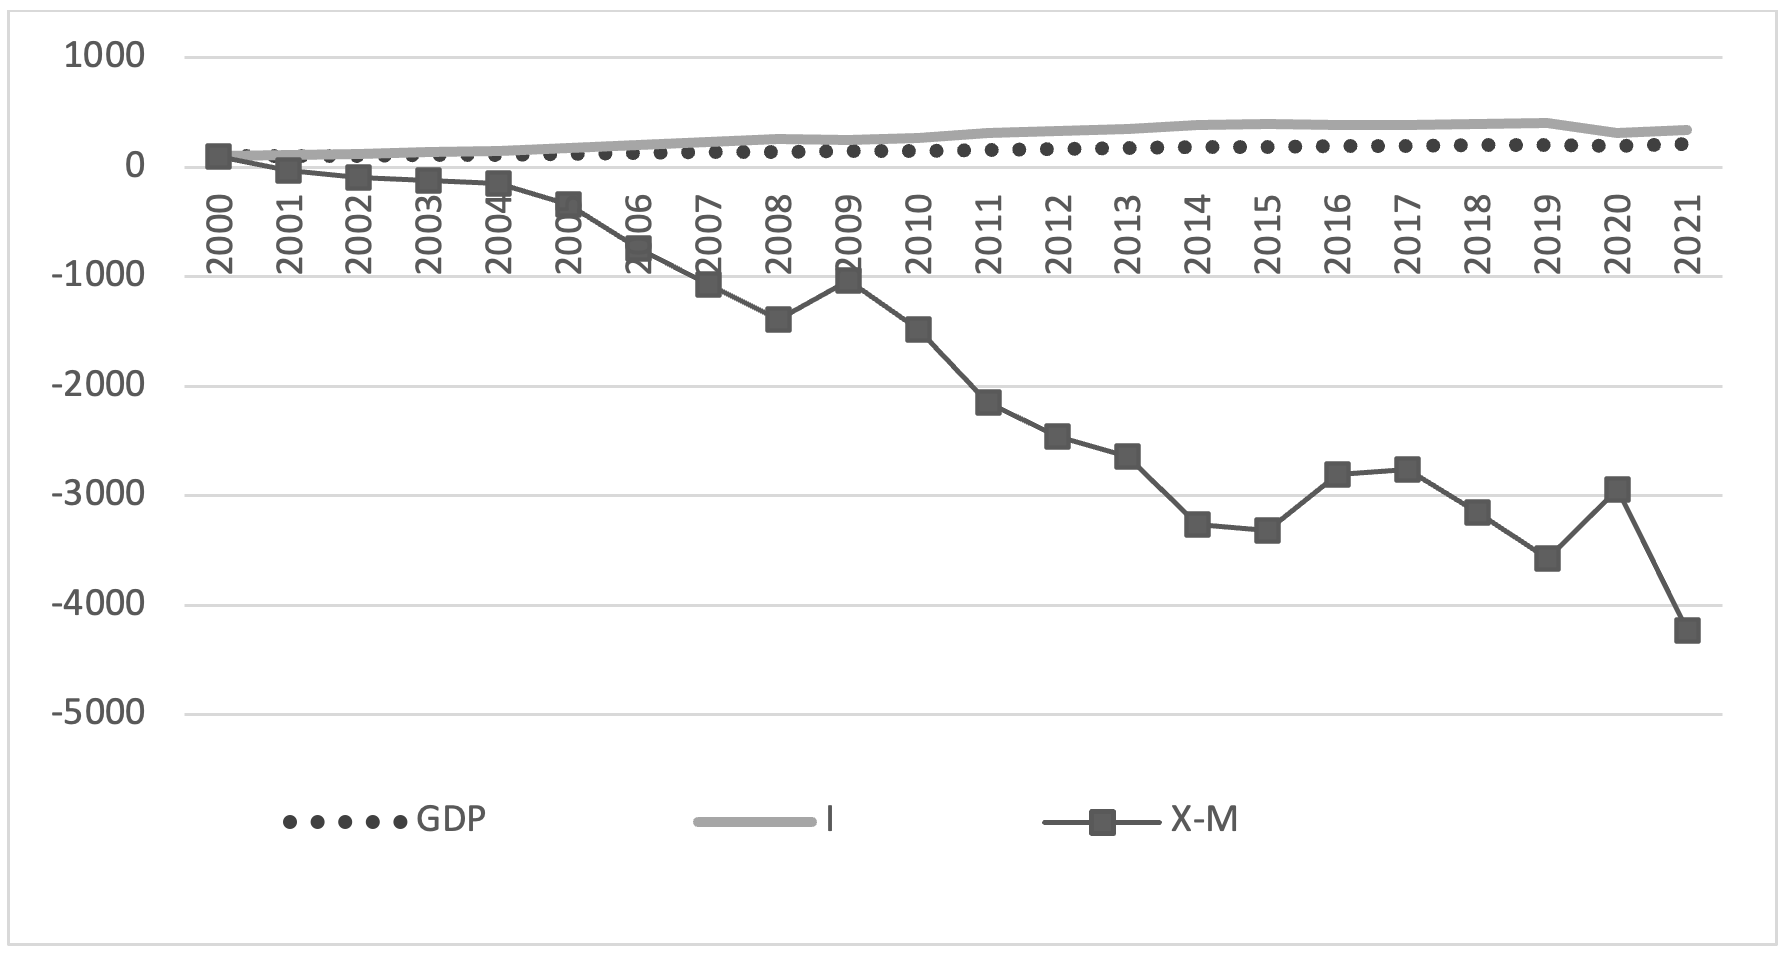
Figure 2. Investment, GDP and Net Exports Evolvement
Source: Own calculations with data from DANE (2024).
To examine the GDP performance, it is necessary to understand, on the one hand, why investment has been volatile and therefore unsustainable, and on the other hand, why exports have performed poorly while imports have grown at a faster pace (see Table 3).
A. Investment and imports
A central point —emphasized by development economists since Smith (2002) first wrote about the employability of labour by capital —is that productive capacity is a function of the amount of capital, which enhances labour productivity. Consequently, the same economic activity can yield higher output (for empirical evidence, see Kaldor (1957, 1961)). Moreover, because labour is employed through capital, the level of employment is directly linked to capital accumulation which stems from investment. Tracking investment is therefore crucial for analysing economic growth, as it determines the capital stock.
The neoclassical notion of capital can be broadened beyond physical durable goods to include the knowledge and skills acquired by workers over time (Barro, 1996). However, for the sake of simplicity and for the purpose of this article, the term will be used to refer exclusively to physical capital.
As shown in Figure 3, there is a striking resemblance between investment behaviour and the evolution of capital-goods imports for agriculture and manufacturing. On one hand, the upward trend in investment aligns with the increasing pattern of capital-goods imports. On the other hand, investment tapers off when there is a significant decline in such imports. This is unsurprising given Colombia's reliance on imported capital goods — such as machinery and equipment — a common feature of resource-rich economies (Smith, 2007).
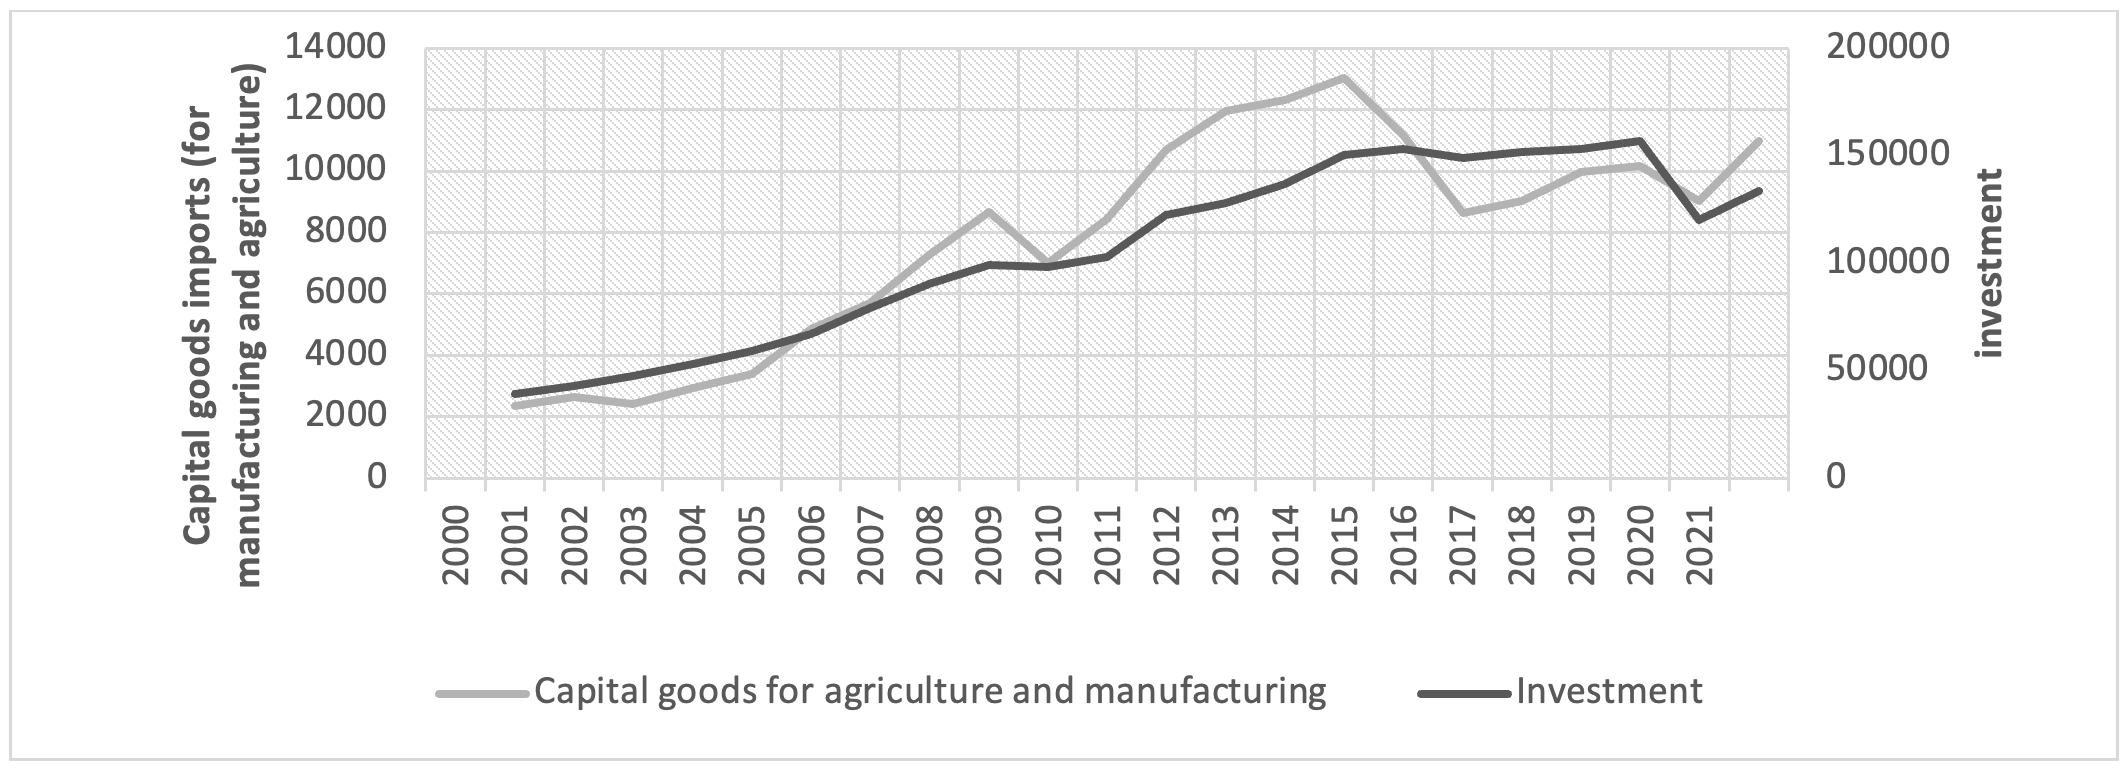
Figure 3. Evolvement of investment and capital goods imports
Source: figure made with data from DANE (DANE, 2024).
It can be argued that given the Colombian economy's reliance on capital-goods imports, it is essential to maintain equilibrium in the external sector —measured by net exports —whenever investment accelerates. To achieve this, exports must be vigorous enough to sustain high investment rates without compromising external balance (Thirlwall, 2012).
When the economy liberalized in 1991-1992, both investment and imports increased significantly—by 47.7% and 39.4%, respectively—and the correlation between these two variables strengthened. Since then, the share of imports and exports in GDP (economic openness) has risen steadily. These stylized facts suggest that investment rates have become increasingly dependent on imports as international trade gained relevance in Colombia's economy.
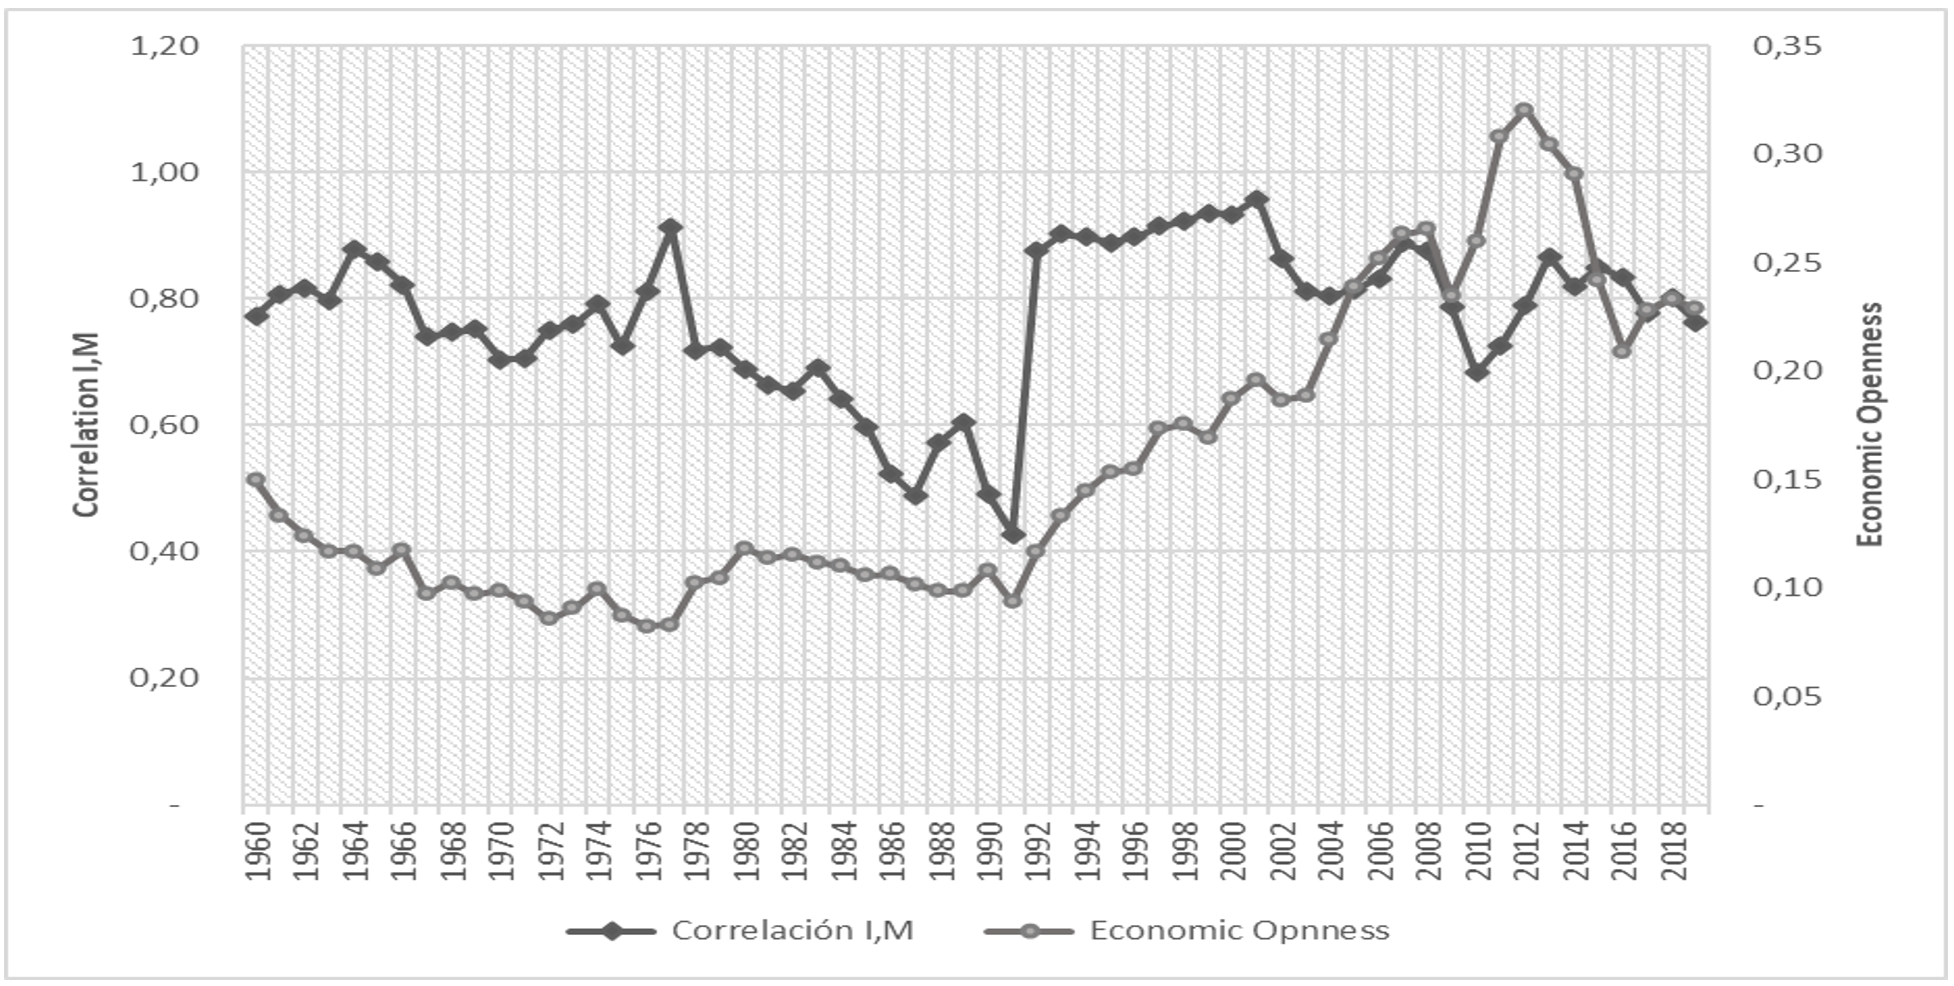
Figure 4. Investment- imports rolling correlation of 10 years and Economic openness
Source: figure made by the author with data from the WPT 10.0. Rolling correlation of 10 years is measured in the left axis while the economic openness is measured in the right axis.
The scatterplot presented in Figure 5 is based on data from 2001 to 2021, comprising 21 data points. It illustrates Colombia's dependence on foreign capital goods, with higher investment rates corresponding to increased imports. Although a larger sample size would be required to draw definitive conclusions, the positive correlation between the variables and the R² value of 0.44 are noteworthy findings —particularly given that variations in capital-goods imports are explained by a single variable: investment.
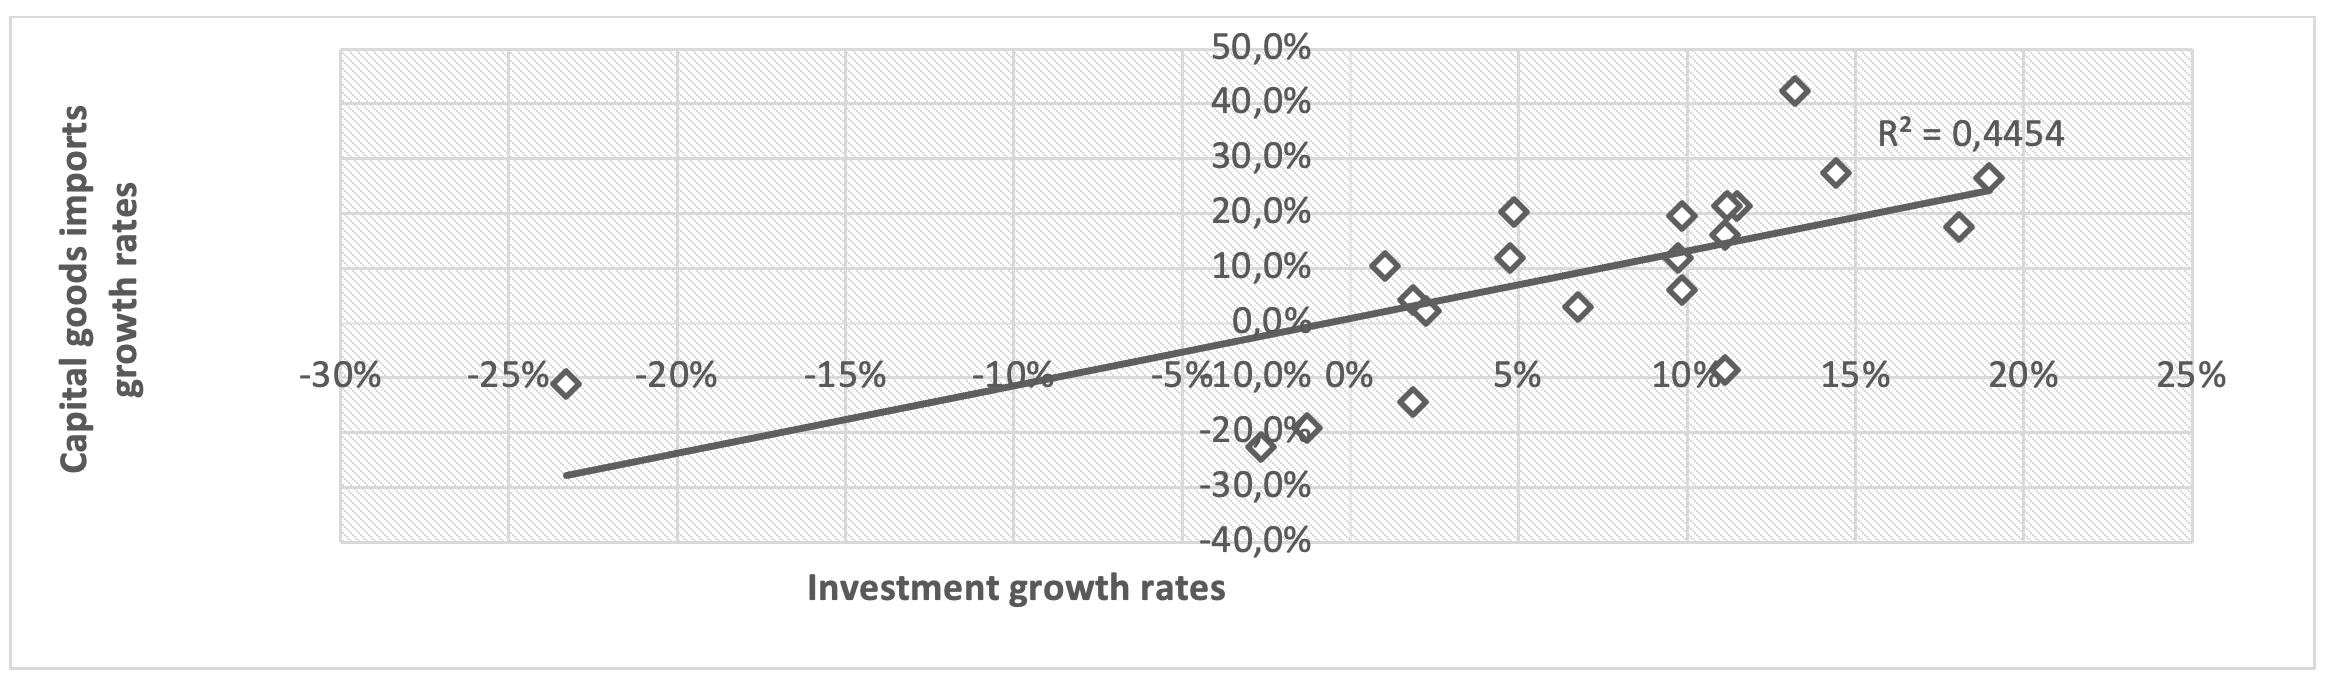
Figure 5. Correlation between Investment and Capital Goods Imports, 2001-2021
Source: own calculations with investment and capital goods imports data from DANE (2024). It is noteworthy to mention that DANE’s data of capital goods imports is made up of both agriculture and manufacturing capital goods.
When examining the behaviour of imports by type of capital goods, it is evident that imports of capital goods for the manufacturing sector exhibit a stronger correlation with investment than those for agriculture sector.
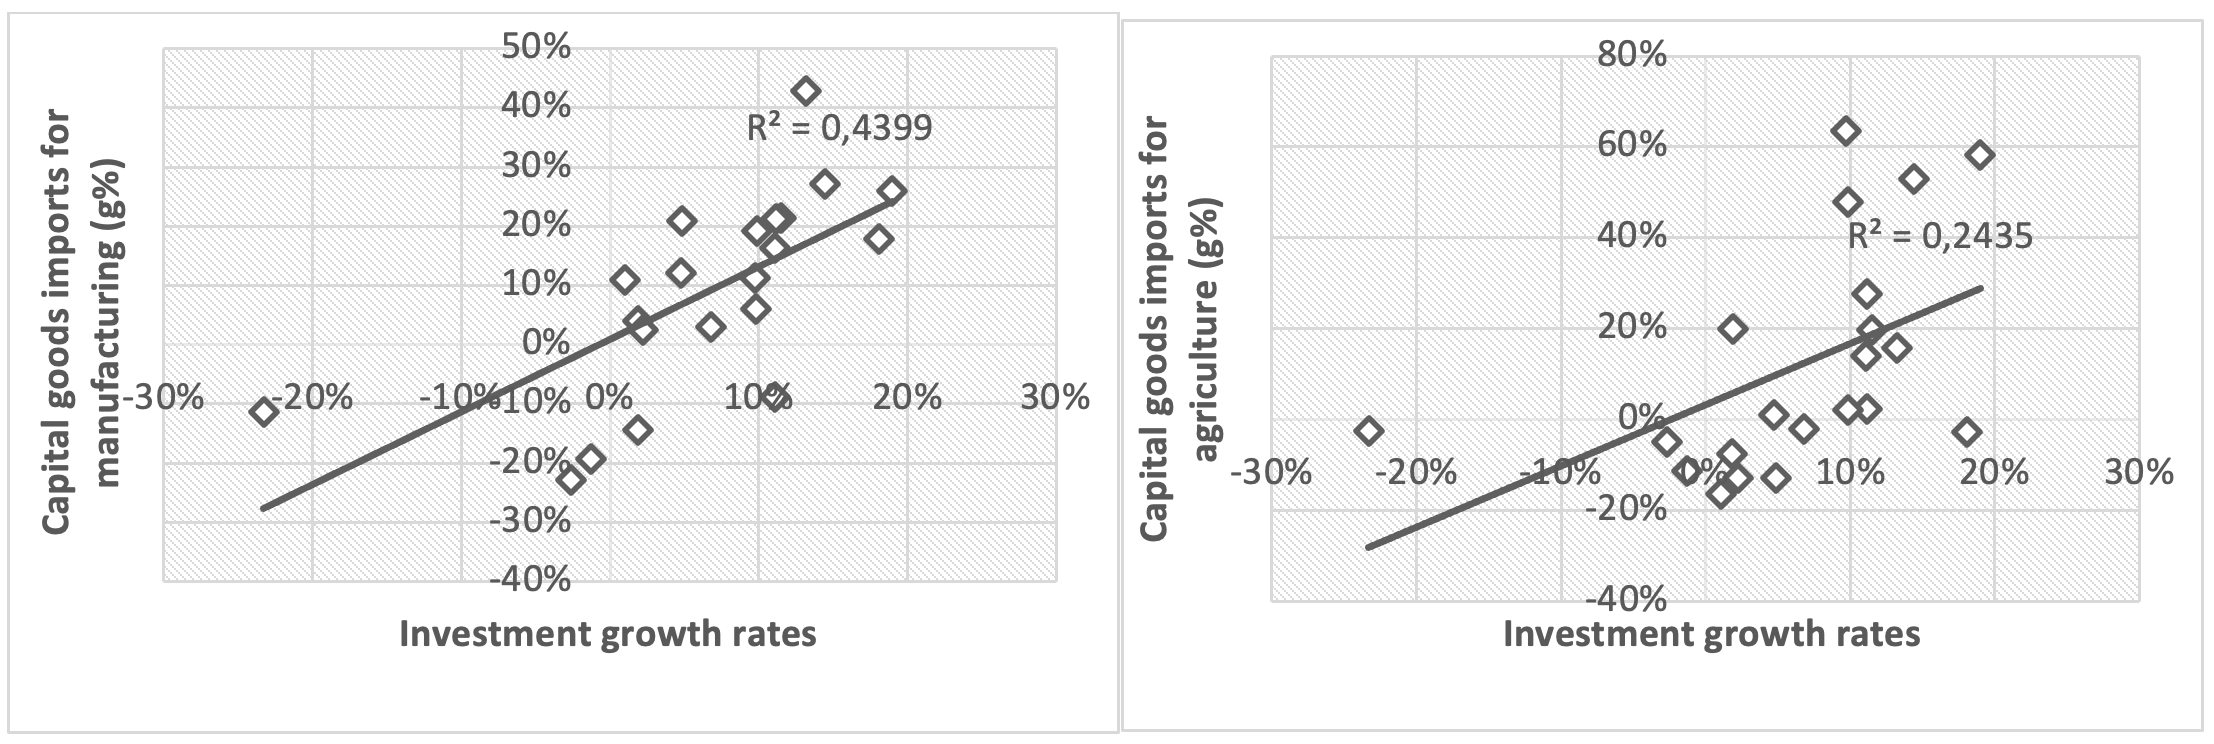
Figure 6. Correlation between investment and Capital goods imports by sector
Source: own calculations with data from DANE (2024).
Imports of agricultural capital goods showed no correlation with investment between 2001 and 2021. This finding suggests that Colombia's manufacturing sector relied heavily on foreign capital goods, while the agricultural sector depend more on domestically produced capital goods. In some cases, farmers may have been able to substitute imported technology with local alternatives —for example, opting for organic rather than synthetic fertilizers. However, it is important to note that this article does not aim to extensively examine the agricultural sector in detail.
The pattern observed for imports of raw materials and intermediate goods follows a trend similar to that capital goods. The manufacturing sector exhibits greater dependence on foreign production compared than agriculture. In contrast to the capital-goods case, however, the agricultural sector shows a higher correlation. This suggests that Colombia's agricultural sector relied more on foreign-sourced raw materials and intermediate goods than on foreign capital goods.
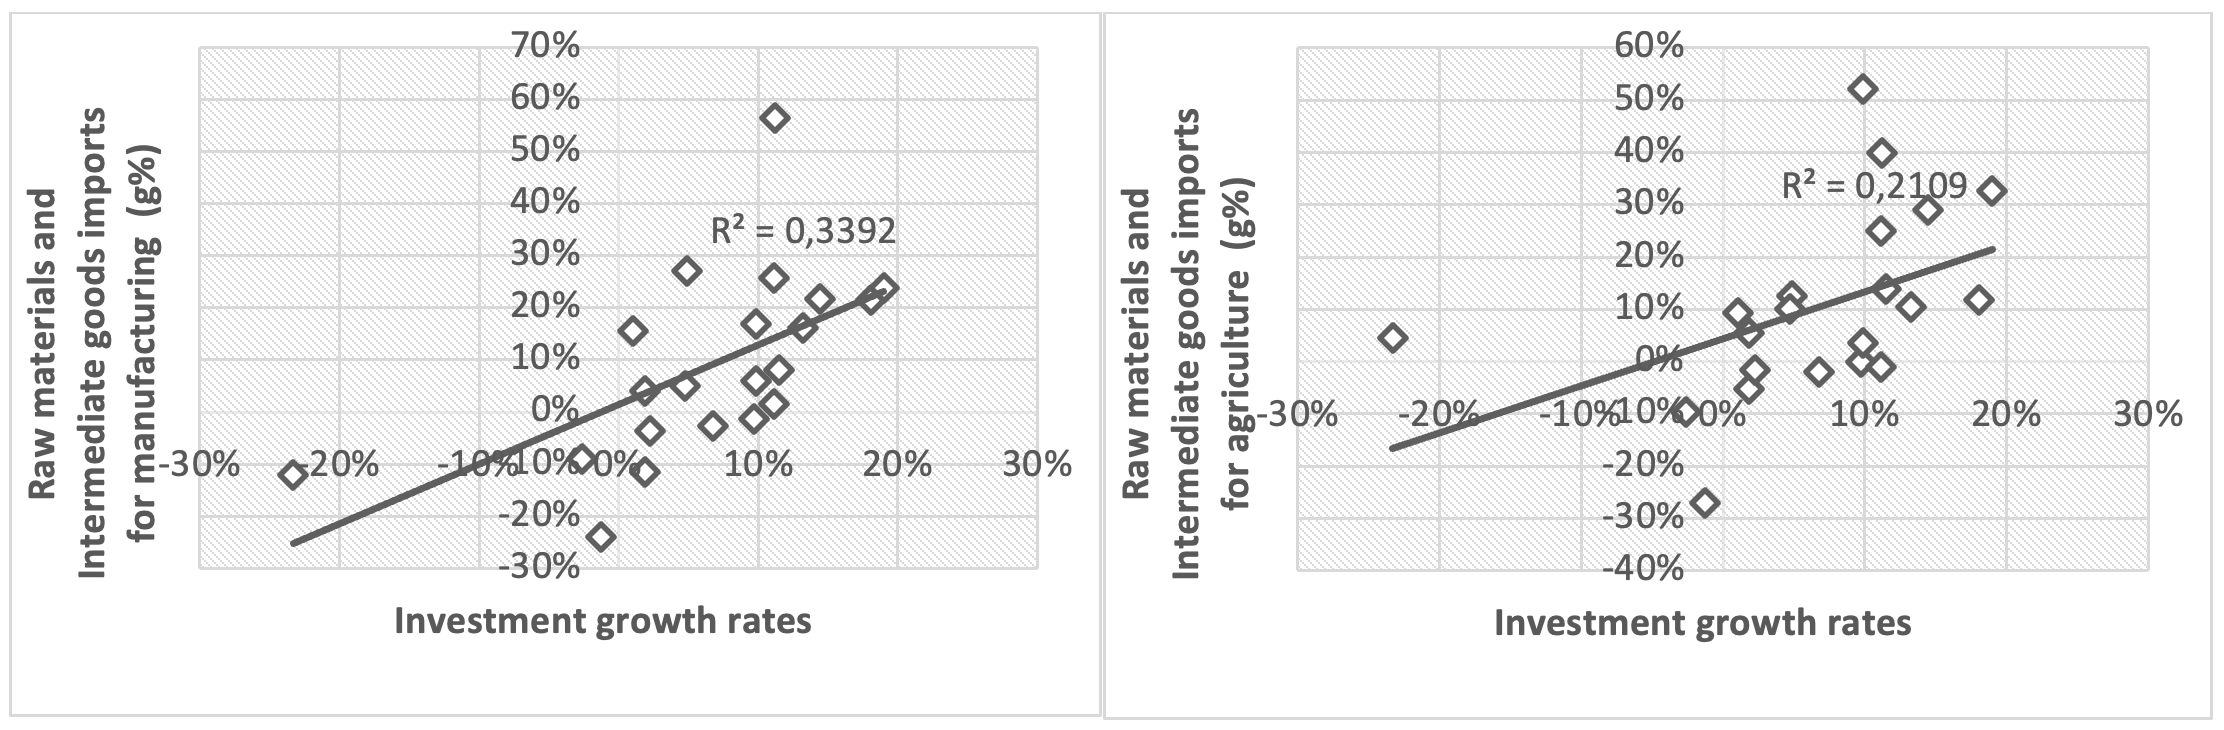
Figure 7.Correlation between investment and raw materials and intermediate goods imports by sector
Source: own calculations with data from DANE (2024).
The correlations discussed above highlight the relationship between investment and imports according to their respective types. Manufacturing demonstrates greater reliance on capital-goods imports than imports of raw materials and intermediate goods, as reflected in the R² values from each regression. This interpretation aligns with Prebisch's (1988) broader notion of the dependence of peripheral economies on industrial centers.
The following table presents the elasticity of imports with respect to GDP and investment. Overall, the evidence shows that imports are responsive to changes in GDP, meaning that the expansion of Colombia’s economy has led to increased imports. By contrast, the elasticity of imports with respect to investment displays greater variability, shifting between elastic and inelastic over time. Notably, between 2002 and 2015, the investment elasticity of imports followed an inverted U-shaped pattern, peaking at 7.12 in 2009. These years of elastic imports align with the resource boom period, as illustrated below.
Table 4. Elasticity of imports to GDP and investment
| Years | Elasticity of imports with respect to GDP | Elasticity of imports with respect to investment |
|---|---|---|
| 2000 | n.d | n.d |
| 2001 | 5.21 | 0.90 |
| 2002 | 0.13 | 0.03 |
| 2003 | 2.09 | 0.71 |
| 2004 | 1.93 | 0.92 |
| 2005 | 2.53 | 0.90 |
| 2006 | 2.98 | 1.11 |
| 2007 | 2.04 | 0.97 |
| 2008 | 2.95 | 1.06 |
| 2009 | 5.54 | 7.12 |
| 2010 | 2.73 | 2.23 |
| 2011 | 3.26 | 1.13 |
| 2012 | 2.24 | 1.91 |
| 2013 | 1.23 | 0.88 |
| 2014 | 1.79 | 0.80 |
| 2015 | 0.46 | 0.77 |
| 2016 | 3.59 | 2.76 |
| 2017 | 0.75 | 0.55 |
| 2018 | 2.26 | 5.60 |
| 2019 | 2.30 | 3.28 |
| 2020 | 2.91 | 0.88 |
| 2021 | 2.61 | 2.46 |
| Average | 1.58 | 1.76 |
Source: own calculations with data from DANE (2024).
Next, we analyze Colombia's integration into the world economy and the behavior of the exchange rate.
3. Colombia’s external sector 2000-2016
A. Resource-Intensive exports and foreign direct investment
In 1992 Colombia implemented a set of reforms to its economic model, adopting a new approach based on the theory of comparative advantage (Document CONPES 2465, 1990). These reforms aimed to expand the role of market forces by dismantling measures such as Decree-Law 444 of 1967 (Decreto 444, 1967), which had focused on export promotion and diversification. As a result, the market began to play a more prominent role in allocating resources across industries. It is important to note that these changes occurred within the broader context of global neoliberal policies, which, as described by Palma (2019), led to a prolonged process of deindustrialization.
An examination of Colombia’s exports reveals that the mining sector experienced significant growth in its share between 2004 and 2014, reaching nearly 60% of total exports — a period that corresponds to the resource boom, discussed later. Table 5 presents the shares of the three major sectors — agriculture, mining, and manufacturing — in total exports. From 2010 to 2018, Colombia’s export structure was predominantly specialized in mining activities, reflecting a strong orientation toward resource-intensive industries.
Table 5. Exports by Sector as a percentage of total exports
| Year | Agriculture | Mining | Manufacturing |
|---|---|---|---|
| 2000 | 16.9% | 37.2% | 44.7% |
| 2001 | 15.3% | 30.7% | 52.5% |
| 2002 | 16.3% | 29.8% | 52.5% |
| 2003 | 15.2% | 29.6% | 53.6% |
| 2004 | 14.0% | 28.6% | 55.7% |
| 2005 | 8.5% | 30.8% | 59.0% |
| 2006 | 7.6% | 30.3% | 60.6% |
| 2007 | 7.0% | 29.9% | 62.0% |
| 2008 | 5.6% | 37.4% | 56.1% |
| 2009 | 6.3% | 42.0% | 50.8% |
| 2010 | 5.4% | 48.2% | 45.7% |
| 2011 | 4.0% | 55.7% | 39.7% |
| 2012 | 4.3% | 56.9% | 38.4% |
| 2013 | 4.4% | 58.4% | 36.8% |
| 2014 | 4.6% | 59.4% | 35.5% |
| 2015 | 6.6% | 48.8% | 44.1% |
| 2016 | 8.1% | 41.6% | 50.0% |
| 2017 | 7.0% | 47.6% | 45.1% |
| 2018 | 6.5% | 48.9% | 44.3% |
| 2019 | 7.4% | 45.5% | 46.9% |
| 2020 | 9.7% | 34.8% | 55.3% |
| 2021 | 8.5% | 38.2% | 53.1% |
Source: own calculations with data from DANE (2024).
When examining the resource sector, it becomes clear that oil and coal are the dominant subsectors, together accounting for an average of 42% of total exports between 2000 and 2020. The peak occurred in 2014, when oil and coal reached a remarkable 60% share of total exports. Thereafter, their share gradually decline, eventually falling to
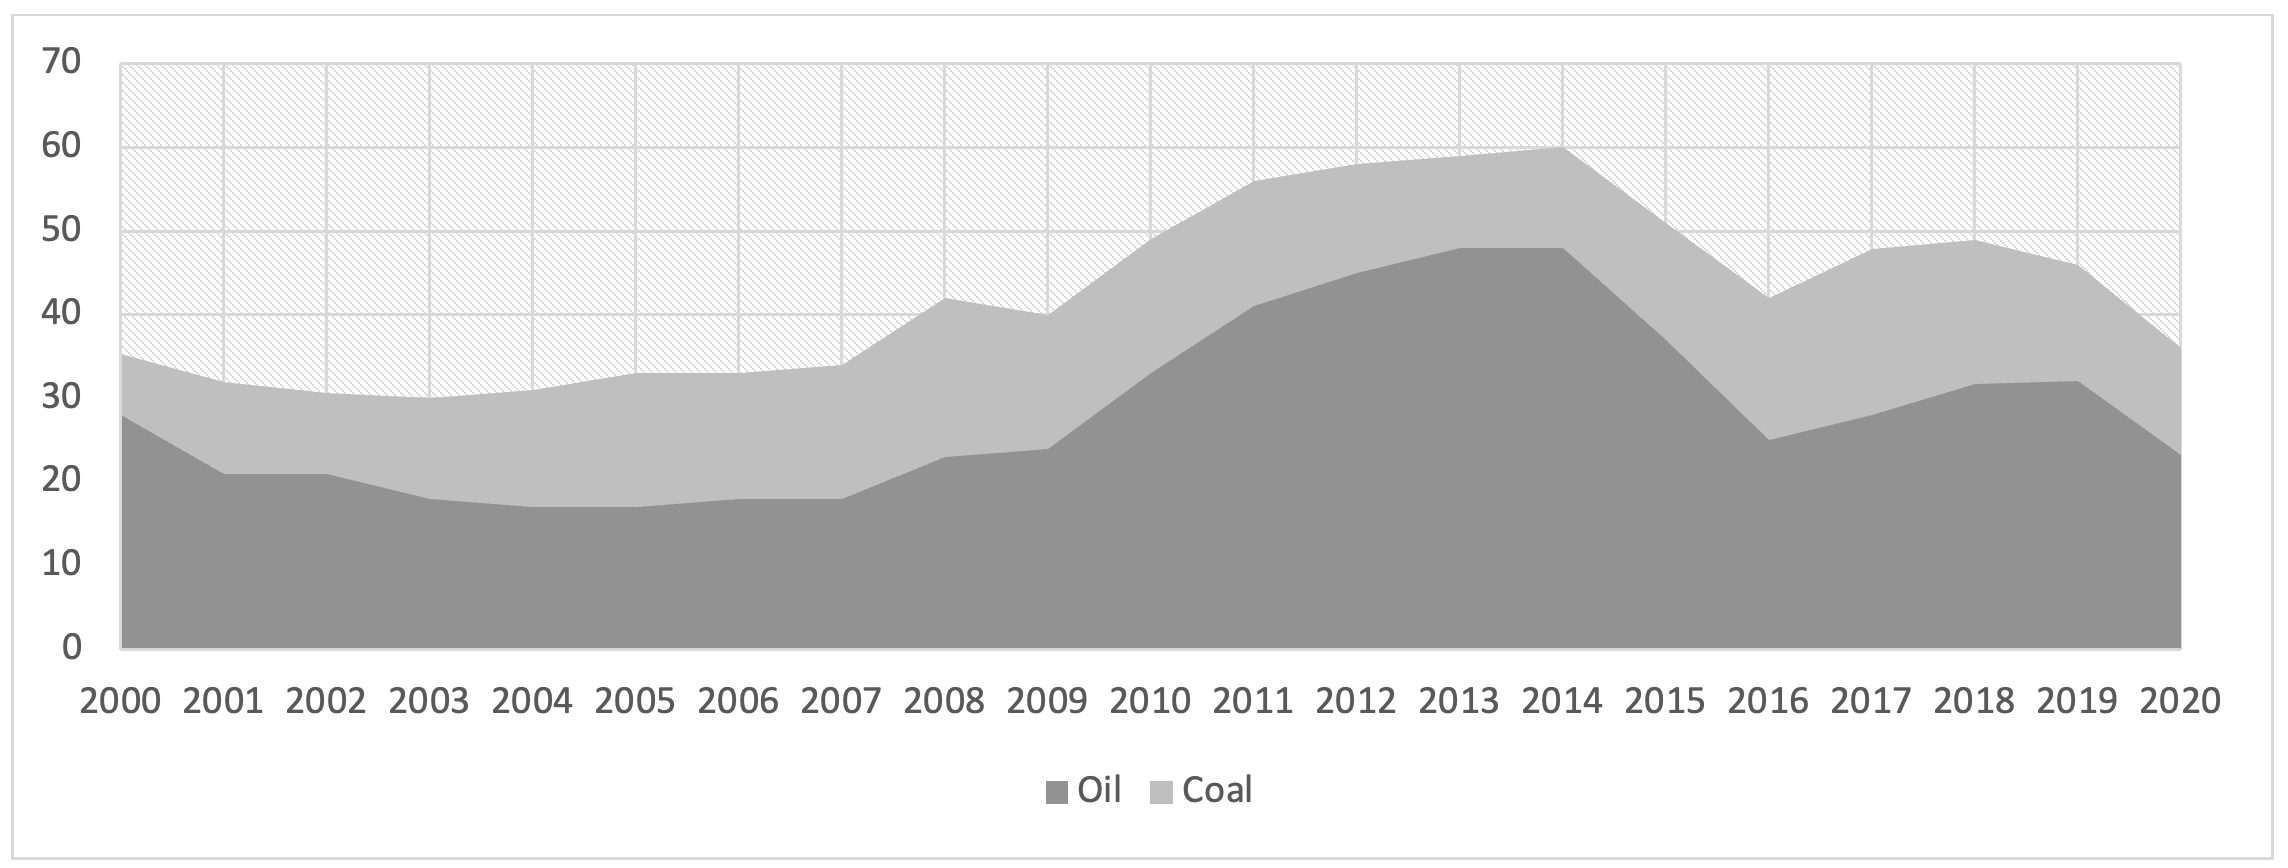
Figure 8. Exports of land-based primary goods
Source: Data from the Observatory of Economic Complexity.
By tracking the interplay between international prices and the exports of oil and coal, Figure 9 highlights the resource sector's strong dependence on global price trends. The data reveal a resource-price boom swiftly followed by a decline in international prices for Colombia’s primary exports activities —oil and coal. (Calculations are based on annual average, considering the mean of both price indexes from the year the decline began through 2016). Oil prices were measured using the Brent and West Texas indexes, while coal prices were based on the Northwest Europe and US Central Appalachian indexes. To smooth representation of the data, a five-year moving average was applied to the international price series.
Figure 9 clearly captures the oil boom, which began in 2000 and peaked in 2014. In contrast, Figure 10 shows the coal boom starting in 2000 and ending in 2012. These findings underscore the resource sector's vulnerability to international price dynamics, as both oil and coal experienced boom periods that subsequently waned due to global market fluctuations.
When the same exercise is applied to the coal industry and its international prices, the relationship becomes evident. Figure 11 demonstrates that the proportion of coal in exports aligns with the fluctuation of international prices.
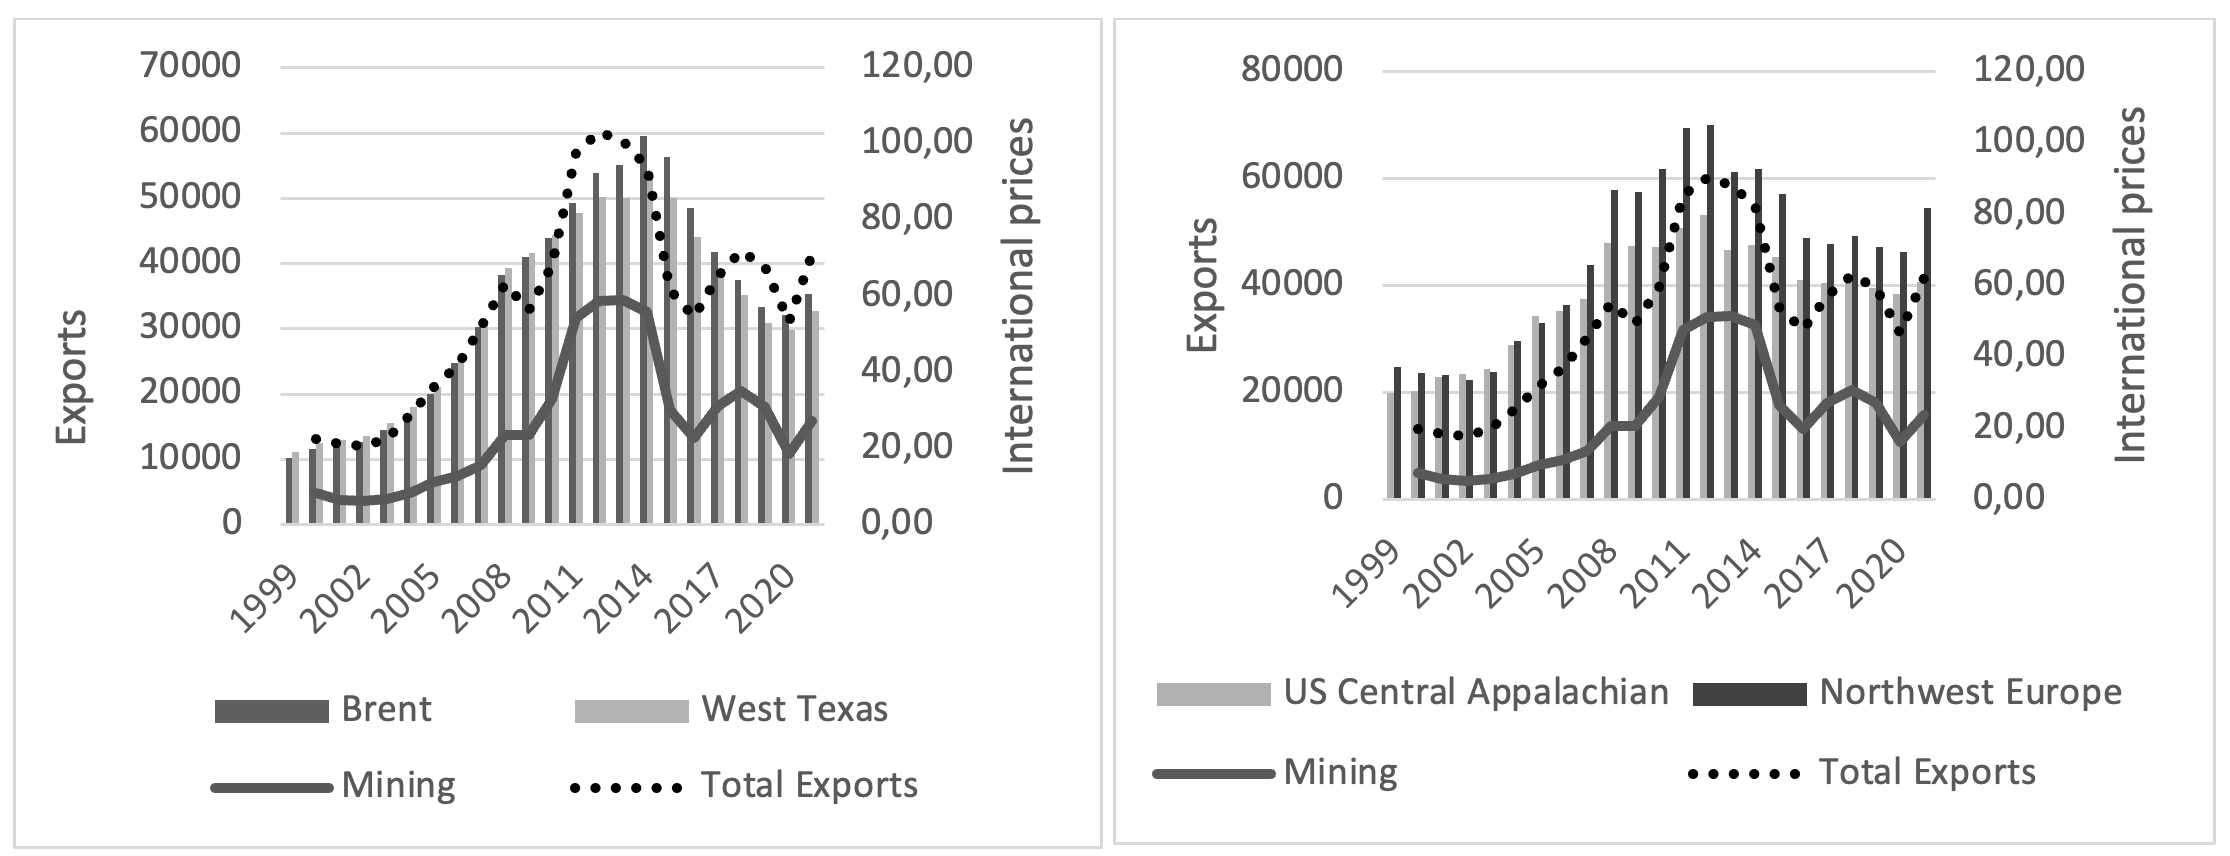
Figure 9. Total and mining exports and International Prices of Oil
Source: Source: own calculations using data from DANE for total and mining exports. International prices of oil and coal are shown using a five-year moving average of the data available in BP Statistical Review of World Energy.
On the other hand, foreign direct investment (FDI) has been a significant source of foreign currency. During the resource boom, there was a substantial increase in foreign capital, primarily directed towards the resource and service sectors. However, once the upswing ended, average FDI levels declined. Notably, mining and services emerged as the two most dynamic sectors, experiencing growth between 2000 and 2004, peaking from 2010 to 2014, and subsequently witnessing a significant decline (Figure 10).
Of particular interest is the sharp downturn in the manufacturing sector between 2020 and 2022, a decline largely attributable to lockdown policies in response implemented to the COVID-19 pandemic.
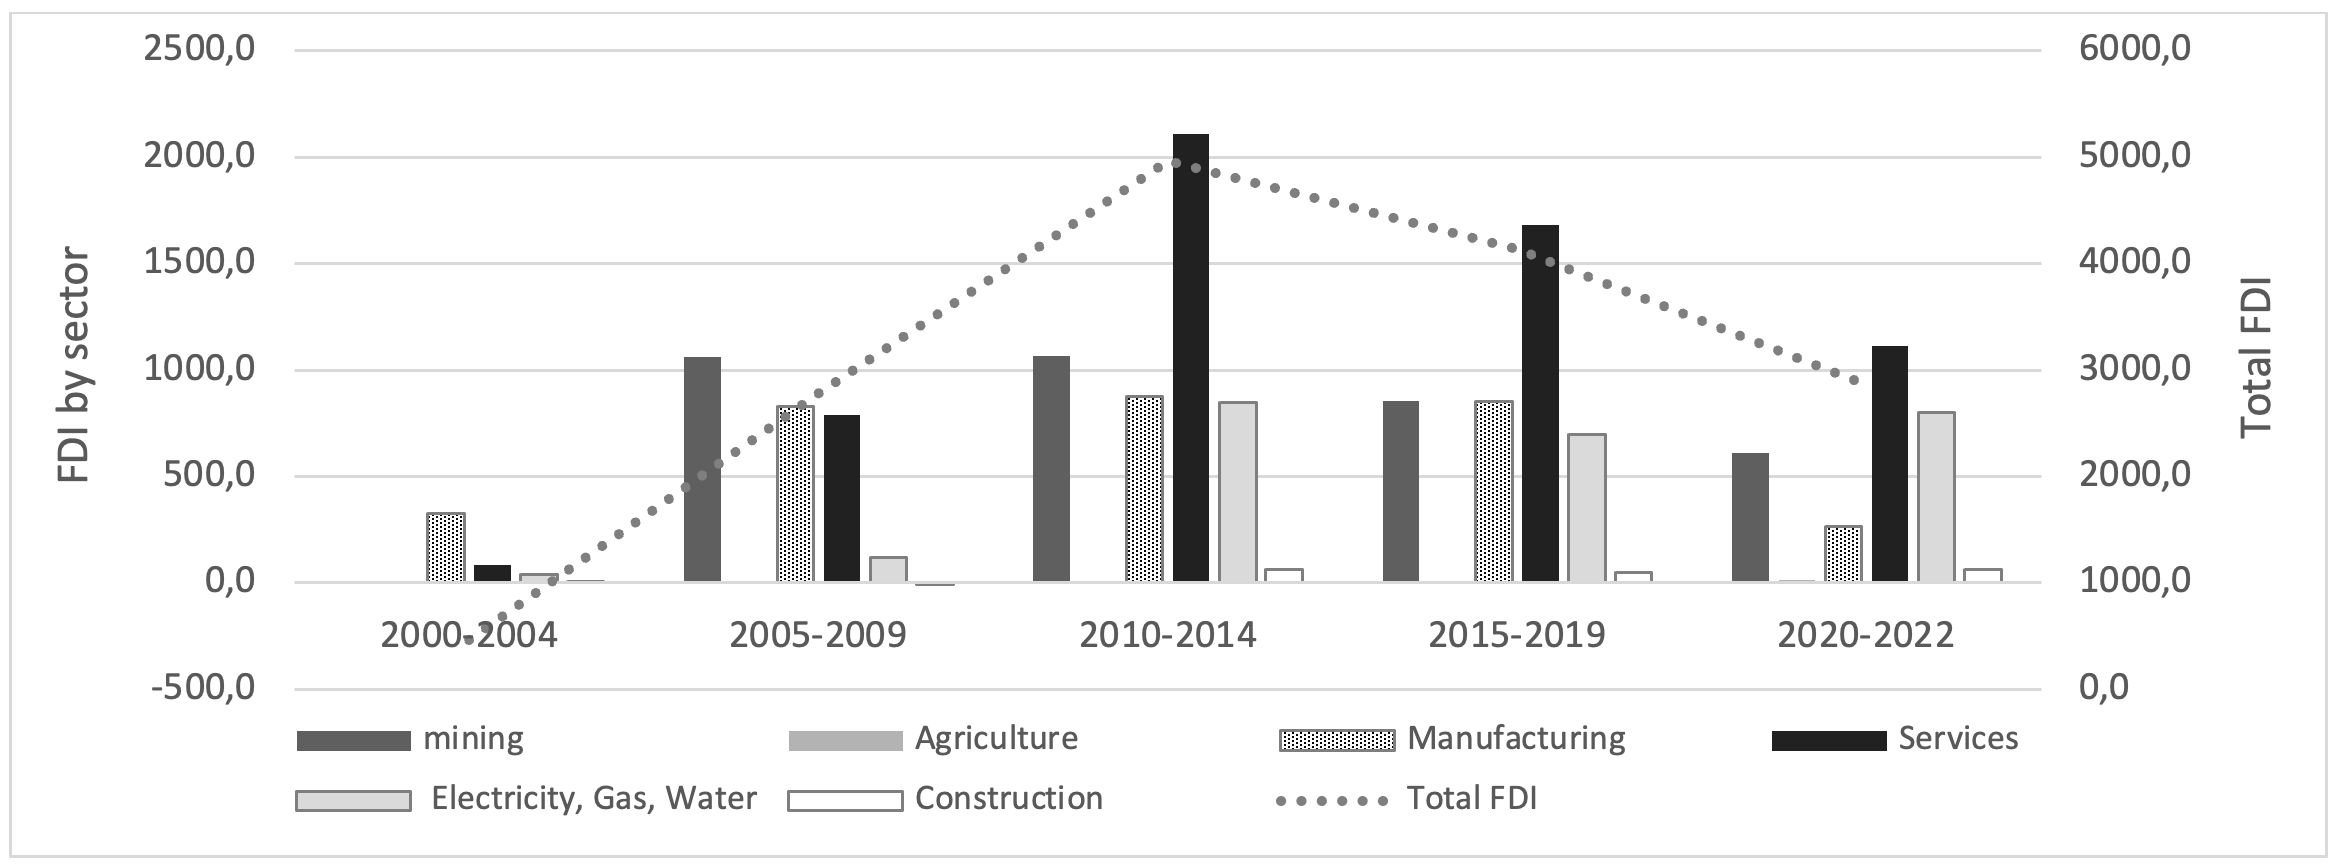
Figure 10. Flows of Foreign Direct Investment 2000-2021
Source: Banco de la República, Department of Economic Studies – Balance of payments.
Similar to exports, foreign direct investment (FDI) also appears to have been influenced by international commodity prices. As shown in Figure 10, FDI closely followed the trend of oil and coal prices. However, when prices began to decline gradually yet substantially, investment in the mining sector fell sharply, followed by subsequent drop in FDI directed to the services sector. This pattern suggests that falling international commodity prices discouraged foreign capital investment in mining.
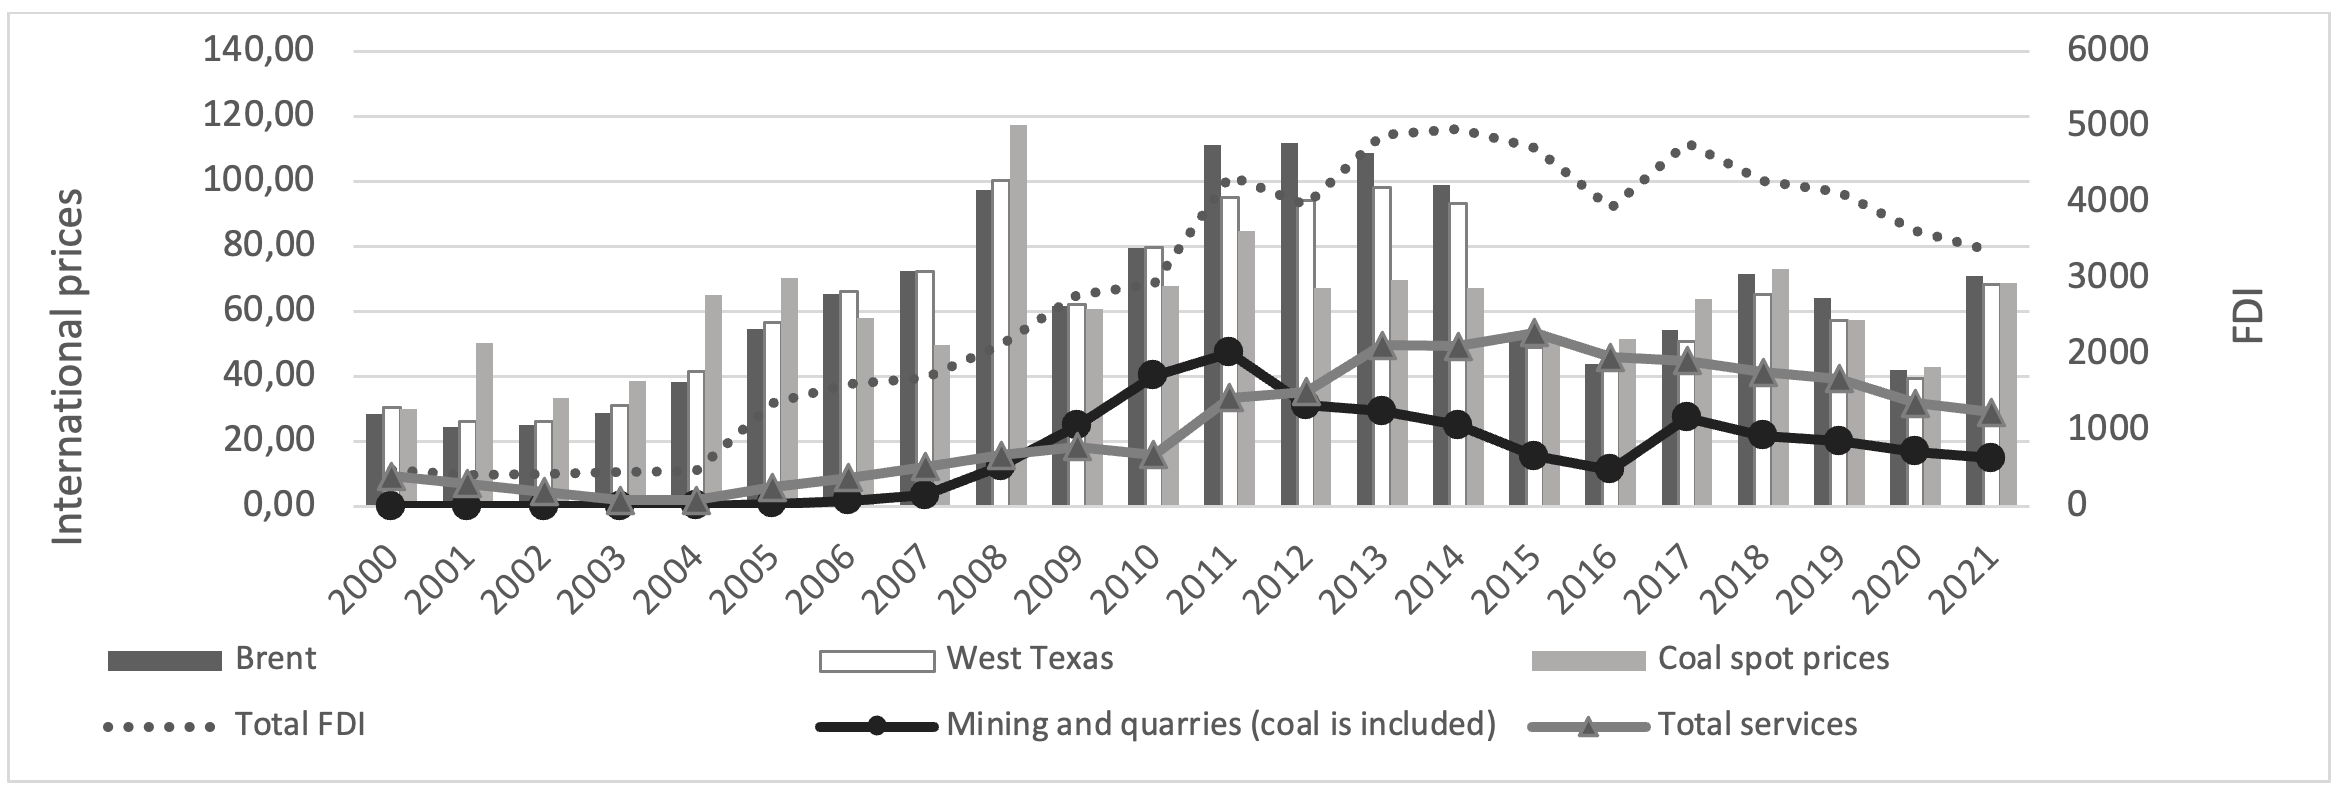
Figure 11. Oil FDI in USD Million, International Prices of Oil and Coal in Dollars per Unit
Source: BP Statistical Review of World Energy.
The inflow of foreign exchange slowed as both export performance weakened and FDI declined. Consequently, imports could no longer continue expanding, and an adjustment had to take place by diminishing its pace. In other words, as the inflow of foreign exchange decrease, imports of capital goods and investment must slow down –an outcome predicted by Thirlwall’s (2012) model of the foreign exchange constraint. Figure 11 illustrates the piling up of international reserves during the resource-boom, and the slowdown of its growth rates once such as the commodity boom came to an end in 2014.
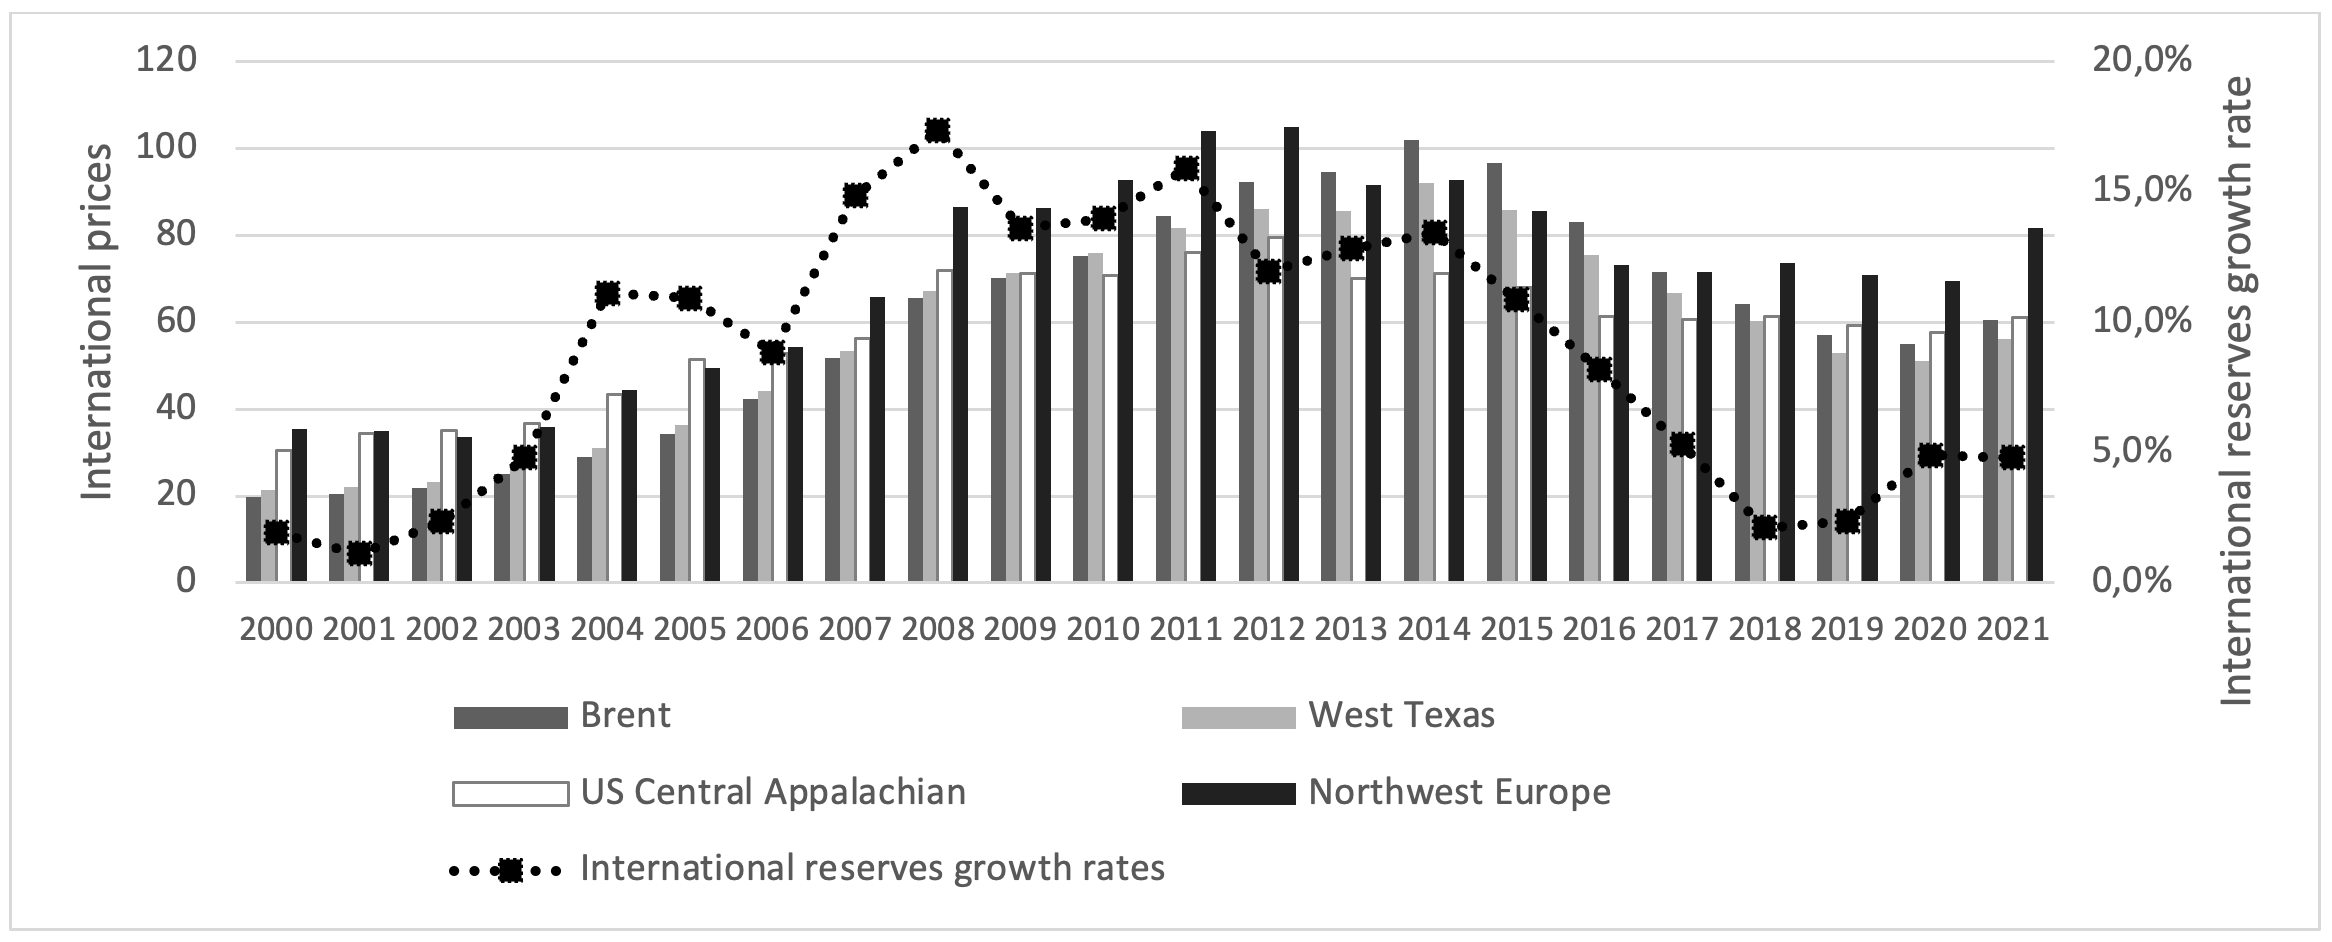
Figure 12. International Reserves and commodity-international prices
Source: own calculations with data from World Bank and BP Statistical Review of World Energy. Five-year moving average was estimated for all data.
Figure 12 displays the interaction between the growth of international reserves and the value of the Colombian peso (COP) against the US dollar (USD). Between 2000 and 2014 — a period that encompasses the resource boom — international reserves accumulated, and the COP appreciated against the USD. However, once coal and oil prices declined, the growth of reserves slowed significantly, and the COP depreciated by 63%, reaching 3,054 pesos per dollar, an exchange rate previously unprecedented in the country’s history. It appears that after the resource boom came to an end, no other sector of the economy was able to generate the same level of international reserves as the resource-based industries (oil and coal).
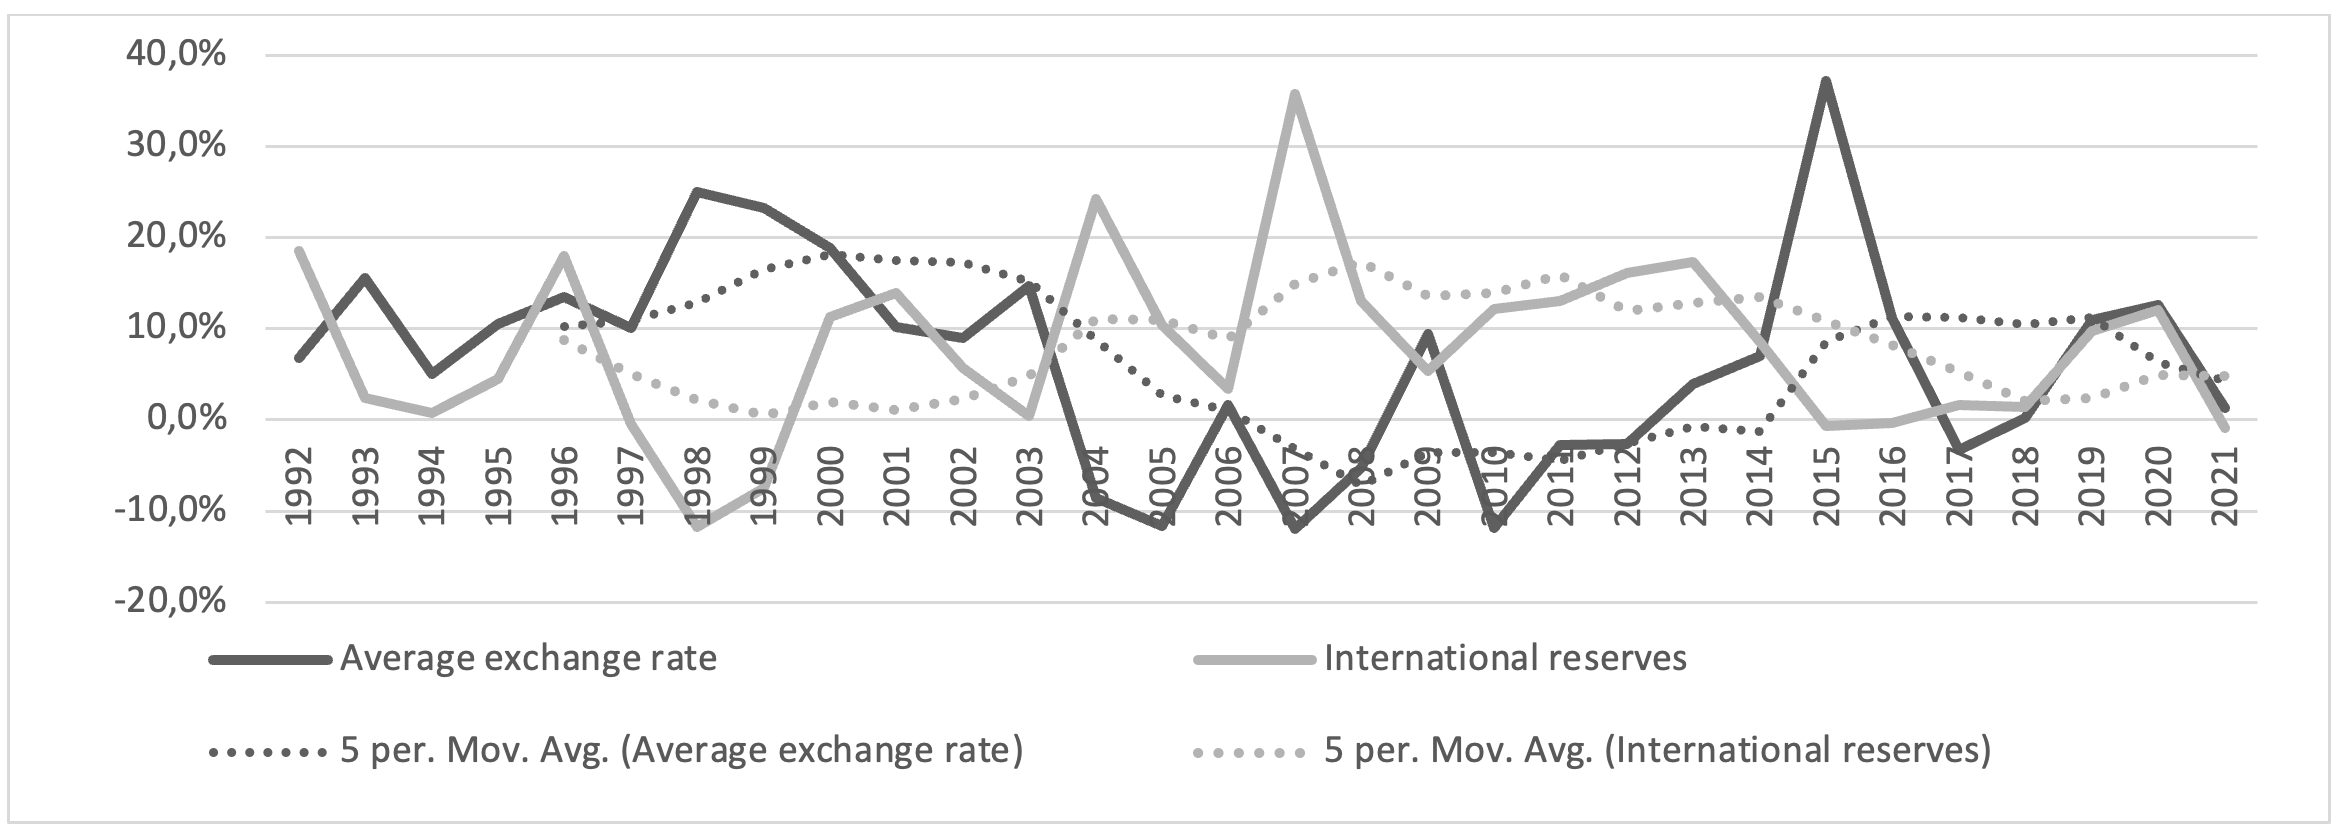
Figure 13. International Reserves and Exchange rate
Source: Own calculations using data from Banco de la República for exchange rates and World Bank for international reserves.
The economy measured by the Real GDP evidently was affected by the commodities prices and its growth rates fluctuated accordingly with the fluctuation of international prices of both oil and coal.
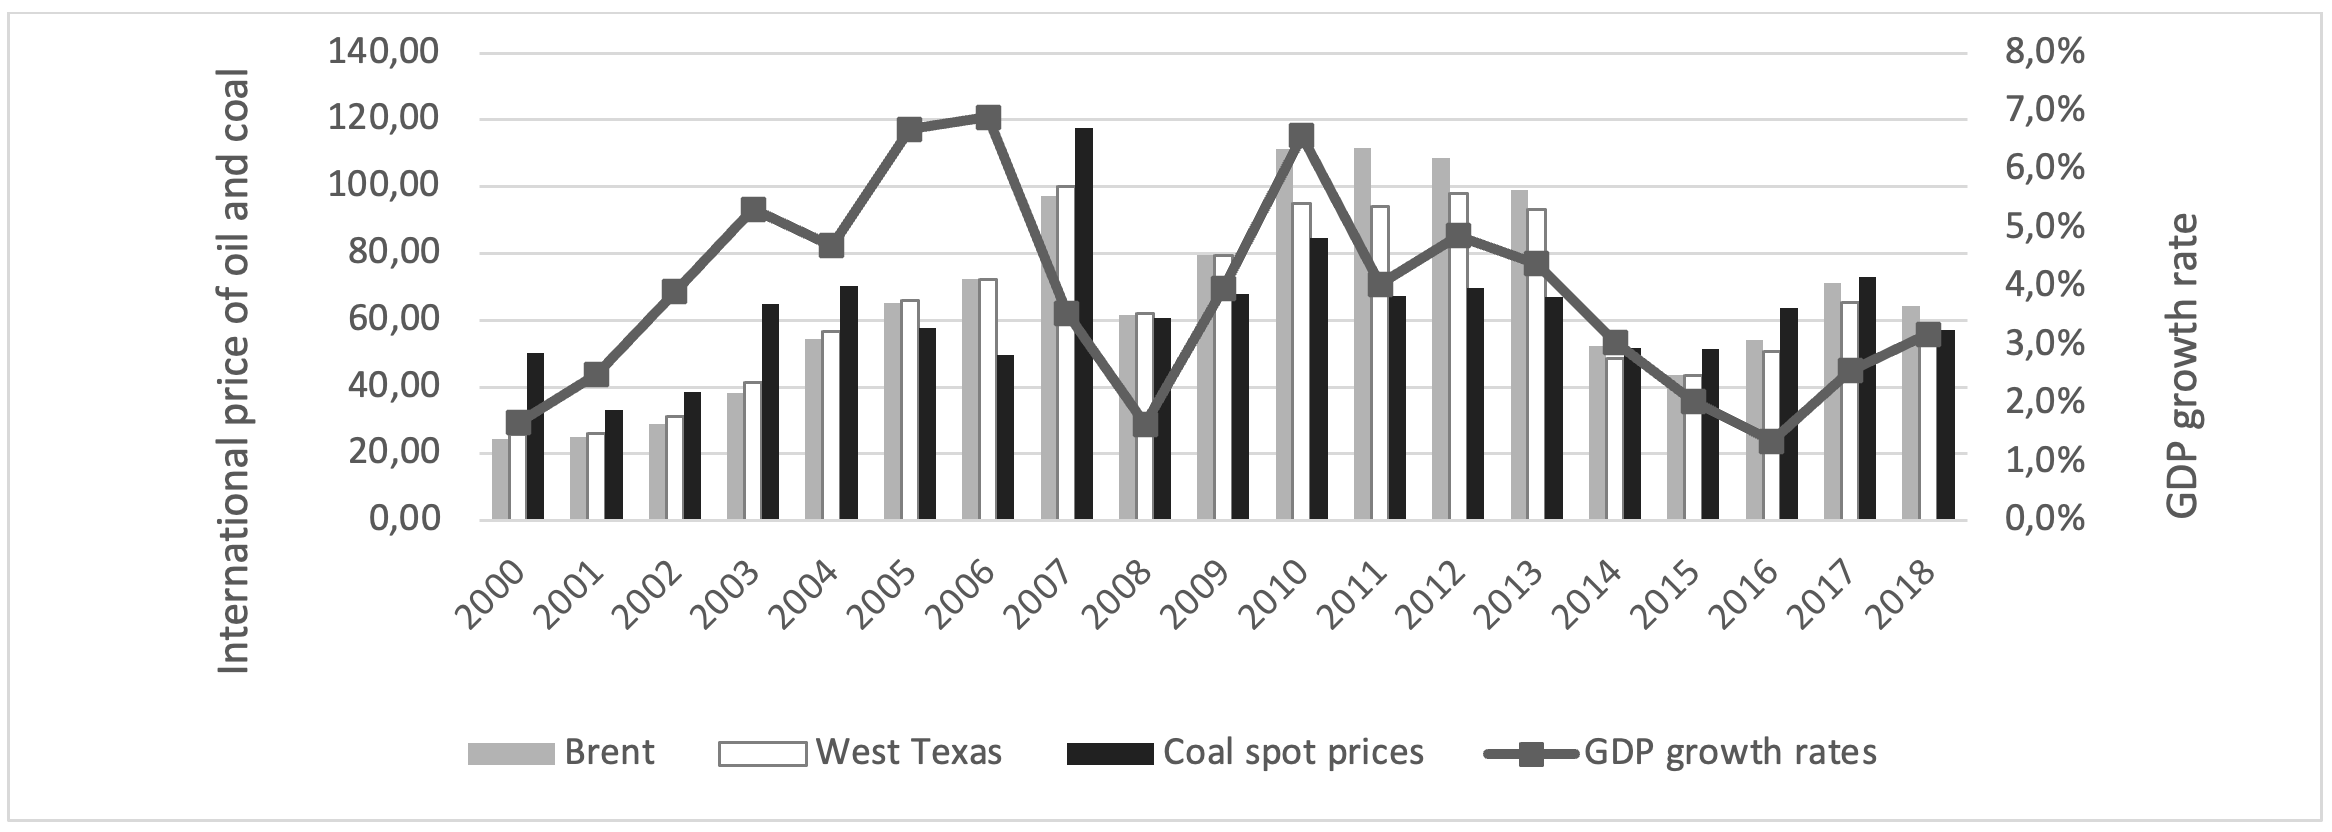
Figure 14. Real GDP Growth, Oil and Coal International Prices
Source: own calculations with data form DANE for GDP. Data of Oil and Coal international prices are from BP Statistical Review of World Energy (2023). The data for 2020 onward were not included to avoid the effect provoked by the Covid-19 pandemic on the time series.
Looking at the trends, when international prices were rising economic growth rates also increased. However, once prices peaked and then declined, the economy slowed down; the dependency of the whole economy on resource-booms is patent. The external sector strongly depends on oil and coal production, such industries that are highly affected by international prices.
Table 6 presents available data on Gross Fixed Capital Formation by component. Although the series extends only to 2016, it nonetheless allows for an analysis of the resource-boom period. It is noticeable that when oil and coal prices soared, the investment grew faster in both items 1) transport equipment1 and 2) machinery and equipment, which makes sense keeping in mind that the growing products turned out must be transported (e.g. oil barrels and coal tons) and the investment in physical capital (machinery and equipment) could be carried out while the economic activity was on the rise.
Nevertheless, during the post-boom downswing, investment in those items fell significantly, declining by -1.5% in machinery and equipment, and -7.2% in transport equipment. The investment was redirected toward nontradable internal activities, namely civil works and building construction. It may be a case of Dutch disease effect, as analyzed by Brahmbhatt, et al. (2010). Overall, however, the investment decreased.
Table 6. GFCF share by sector and International Prices of Commodities changes
| Period | 2001-2013 | 2014-2016 |
|---|---|---|
| Agriculture and Forestry | 3.8% | 2.2% |
| Machinery and Equipment | 13.7% | -1.5% |
| Transport Equipment | 16.5% | -7.2% |
| Building Construction | 8.7% | 5.6% |
| Civil Works | 9.0% | 6.3% |
| Services | 5.3% | 3.4% |
| Total | 10.4% | 2.0% |
| Brent | 15% | -24% |
| US Central Appalachian Coal spot | 17% | -9% |
Source: DANE (DANE, 2024).
Up to this point, it is evident that Colombia, as a small open economy heavily reliant on exporting resource commodities under a free-market policy orientation, appears to be compelled to deepen its focus on resource-driven trade practices. In this context, currency devaluation is often considered a viable strategy to strengthen the external economic sector, as discussed in Guerron's (2013) work. In the following section, we will delve deeper into this subject.
B. Exchange rate CONSTRAINT and manufacturing sectort
The following scatterplot shows the correlation between imports of capital goods and the depreciation of the Colombian peso against the US dollar, measured by the percentage change in the percentage change in the COP/USD exchange rate. The regression line indicates a negative relationship between these two variables, with a R² value = 0.4416. In other words, that is to say, when the Colombian currency ramped up in value, total imports rose, and vice versa, when the Colombian peso depreciated, total imports dropped.
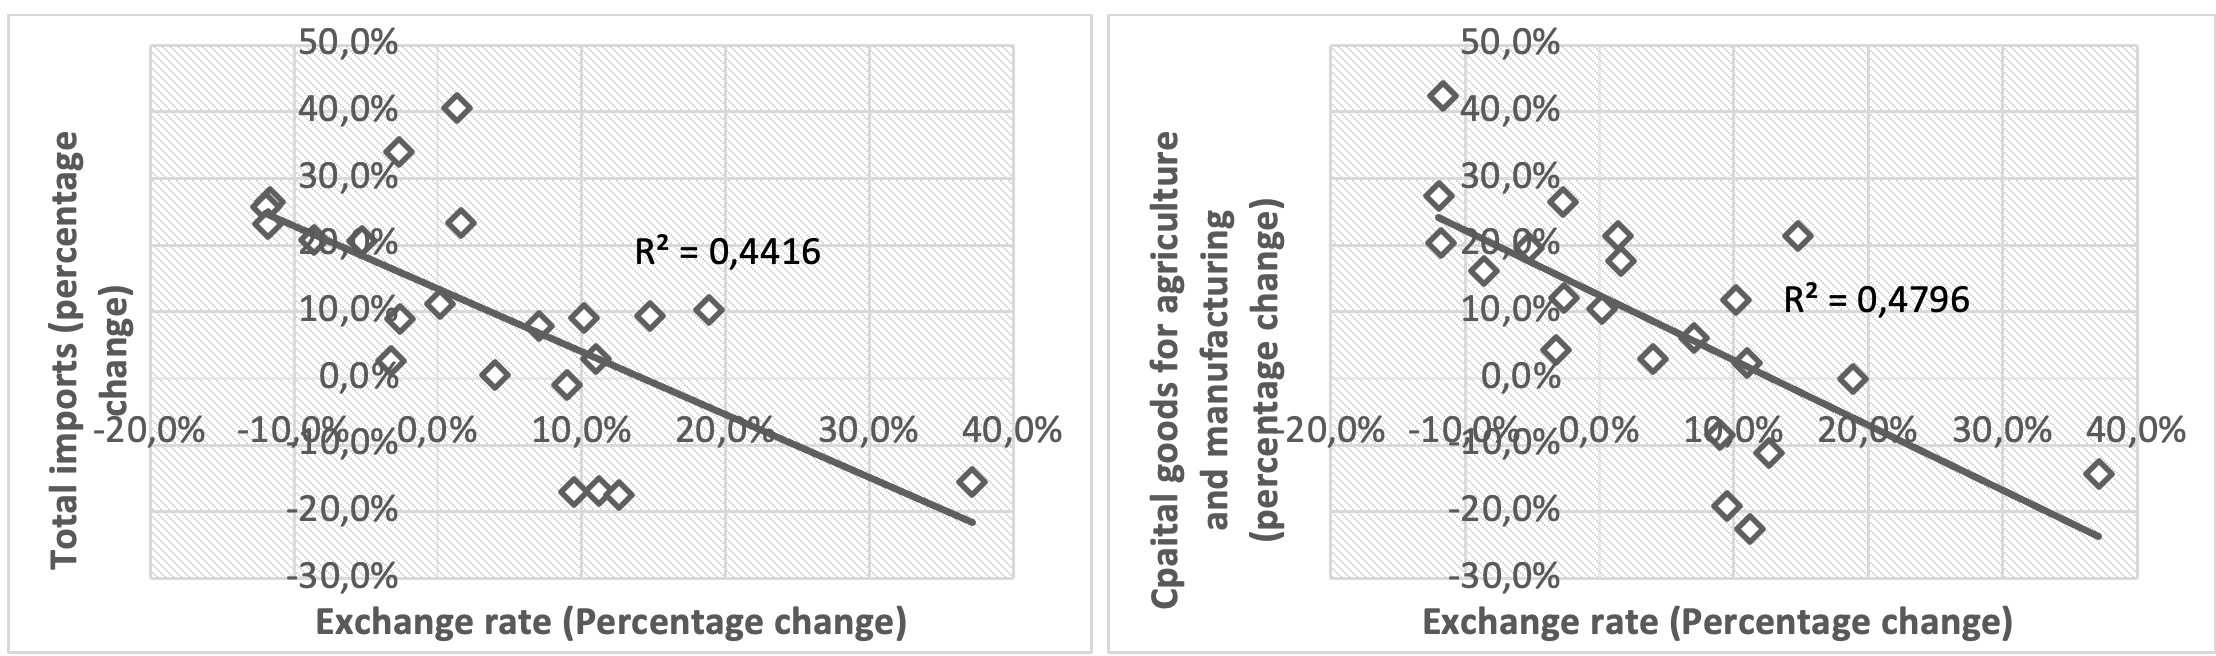
Figure 15. Relationship between total Imports and depreciation of domestic currency 2000-2021
Source: own calculations with data from DANE (DANE, 2024)
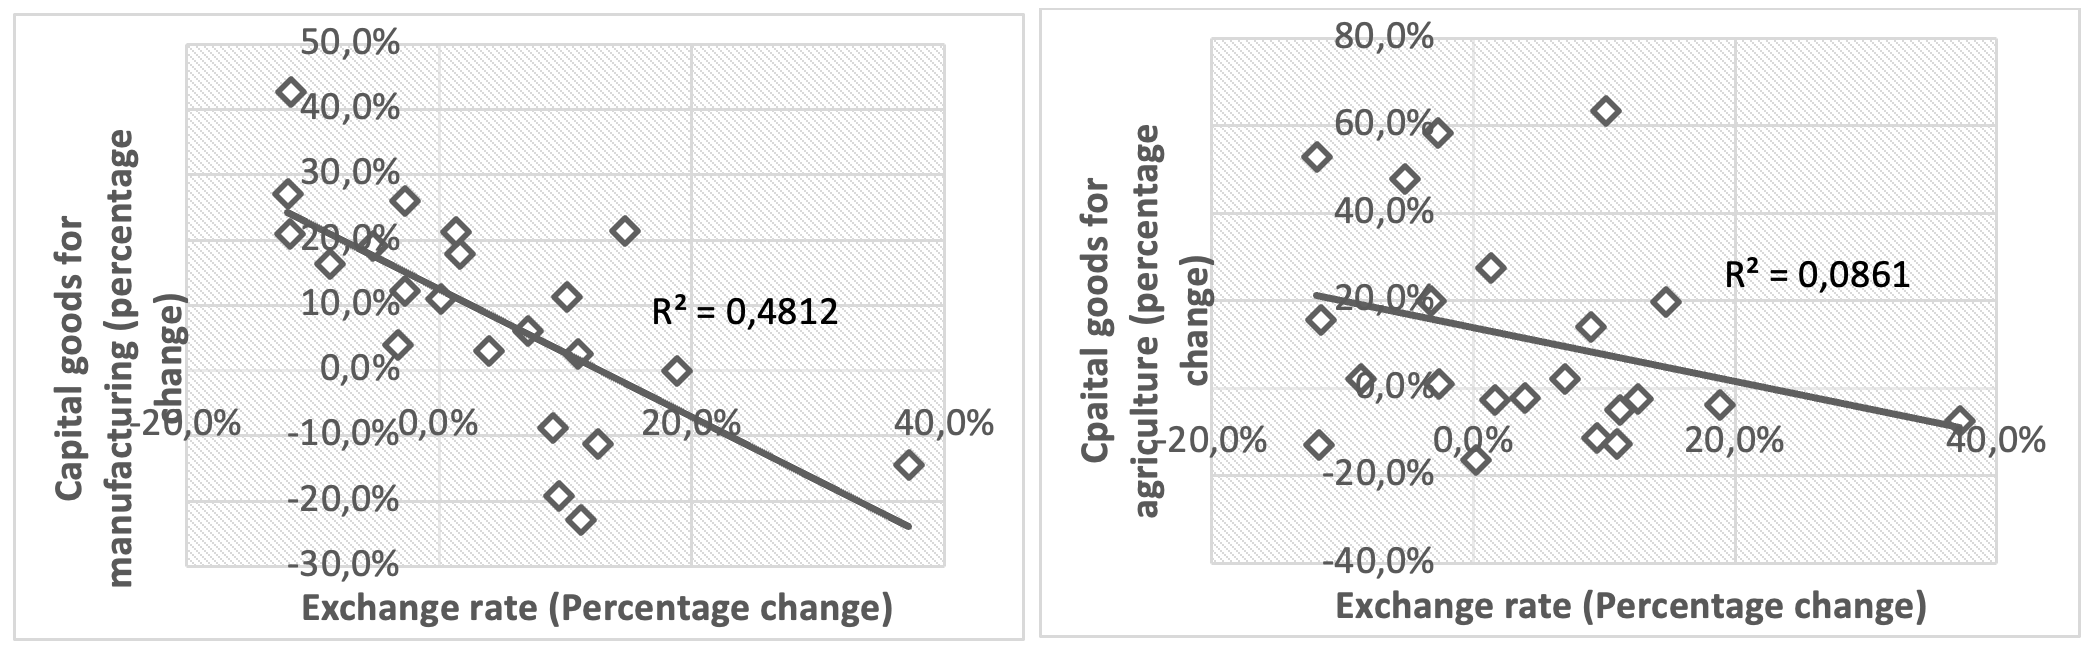
Figure 16. Relationship between imports of capital goods for manufacturing and exchange rate.
Source: own calculations with data from DANE (DANE, 2024)
We can assert that Colombia’s manufacturing sector depends on capital-goods imports and is arguably negatively affected by exchange rate increases (the depreciation of the Colombian peso against the US dollar), which make industrial inputs more expensive. From 2012 to 2021, the exchange rate rose, weakening the value of the domestic currency and driving up the prices of imported inputs demanded by producers. The Producer Price Index (PPI) for imports followed a similar pattern, displaying a U-shaped trajectory alongside the exchange rate. Furthermore, the outbreak of the COVID-19 pandemic between 2020 and 2021 contributed to the rise in import prices.
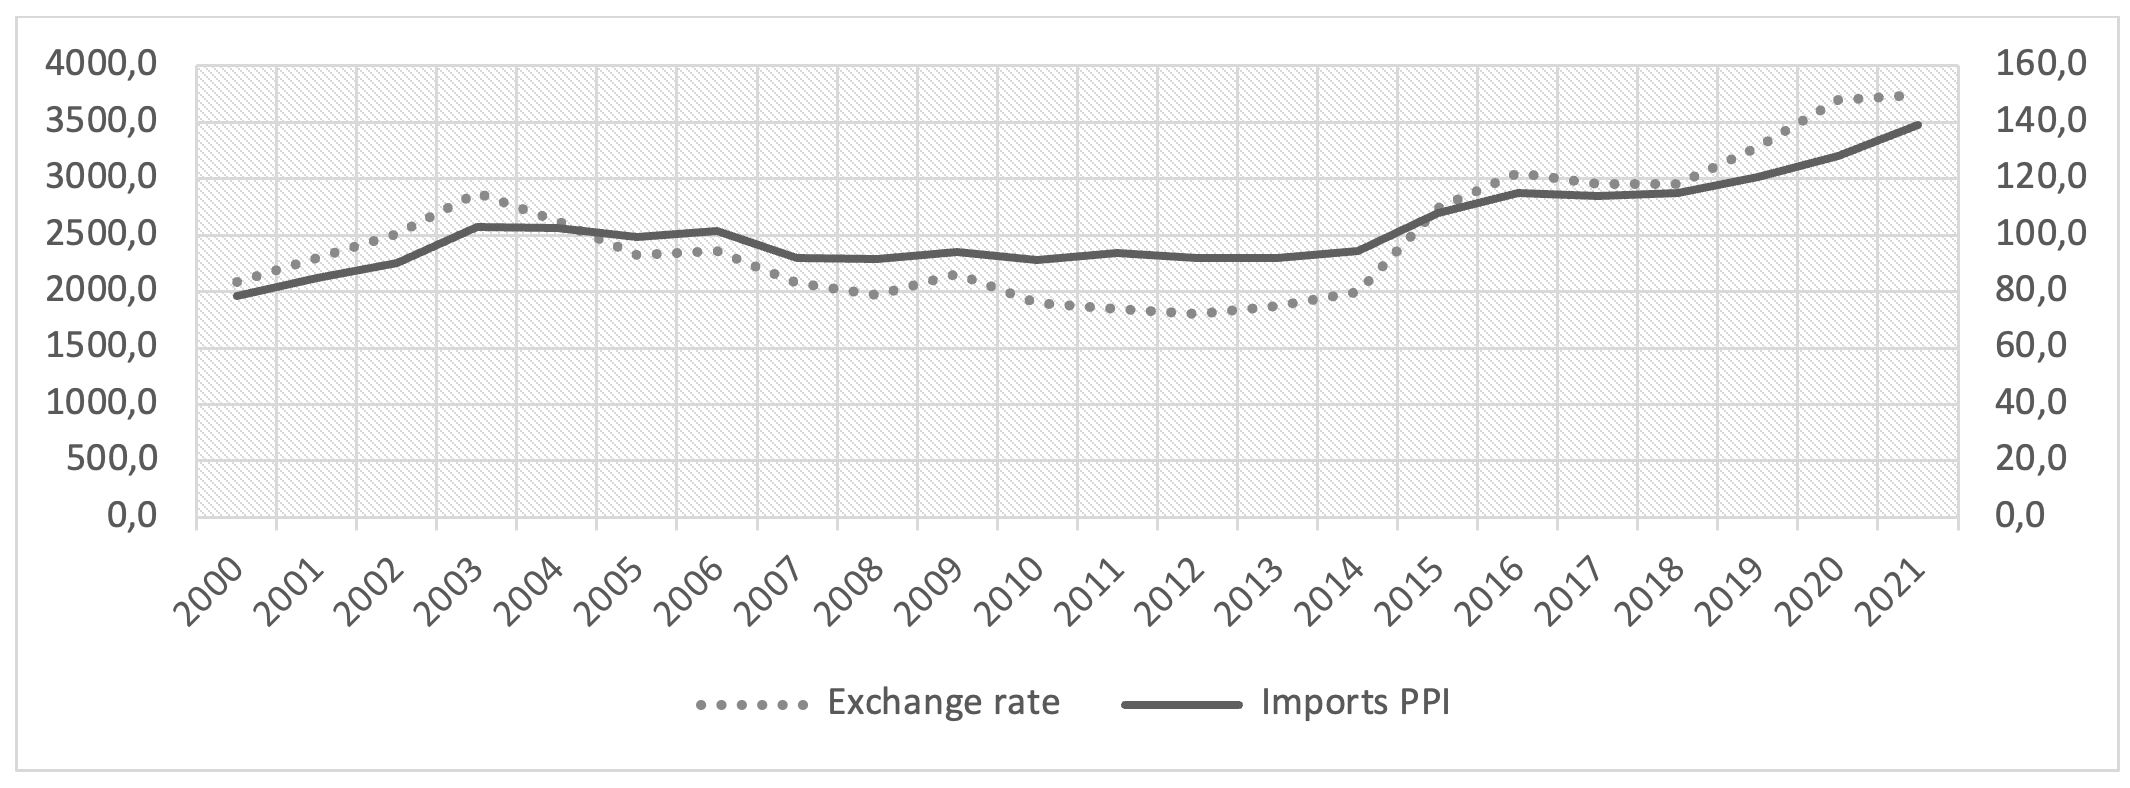
Figure 17. Producer price index of imports and exchange rate.
Source: DANE (2024). Left axis measures the exchange rate and right axis measures Imports PPI
Technological dependence remains a key concern for Colombia’s economic growth (Ortiz Quevedo & Vásquez Castro, 2007). The capacity to import has long been recognized as a structural hurdle in Latin American economies, while manufacturing is viewed as a crucial vehicle for economic development (Prebisch, 1988). From the perspective of Latin American structuralism, balance of payments constitutes a key factor to be solved in order to hold high rates of economic growth (Ocampo, 2014).
What we have seen throughout the stylized facts stood out here endorses the concern on external constraints in the economic development of Colombia and provides insights for further discussions regarding the constraints set up by the amount of foreign exchange in the case of Colombia. These facts also are important for considerations related to the use of international reserves to boost economic development –for instance Gonzales (2016) argues for the potential use of foreign exchange to finance public spending and the optimal level of reserves.
4. Concluding Remarks
This analysis shows that, although the Colombian economy did not stagnate between 2000 and 2021 –excluding a strong downturn in 2020 caused by the COVID-19 pandemic –the economic growth rates relied strongly on international prices of resource-based activities, namely oil and coal, which implied that it rose over 4.0% in the resources-boom but declined in the post-boom downswing, making clear that such an economic growth could not be tenable over time; the case of Colombia illustrates the difficulties faced by a country whose exports are specialized in primary goods.
The stylized facts indicates that the Colombian economy was driven mostly by investment which pulled up GDP growth rates, whereas the net exports pulled it down; thus, both variables played an opposing role. High investment rates stemmed from the resource-boom and brought about imports hikes unmet by exports, which ultimately translated into an imbalance of the external sector. Eventually, the investment momentum was halted by the depreciation of the Colombian currency, slashing the capacity to import.
Several key features characterize Colombia’s economic performance during 2000–2021:
- Investment hikes pulled up imports of capital goods.
- Resource-intensive exports relied highly on international prices, and once the resource-boom came to an end, the international reserves decreased, and the exchange rate ramped up as a mechanism to stop imports.
- In line with Thirlwall’s (2012) model, we may assert that the lack of foreign exchange constituted a constraint for Colombia’s economic growth, and specially, for manufacturing, as such a sector correlates with imports of capital goods.
Prebisch’s (1988) insights on centre-periphery relationship and manufacturing as a key sector to develop (Poveda Ramos, 1997) are still valid in the case of Colombia, given its technological dependence (Ortiz Quevedo & Vásquez Castro, 2007) reflected in its reliance on imports of capital goods and its dependency on primary goods. Colombia’s economic growth of 2000-2021 –boosted by oil and coal –illustrates that although markets can deliver short-run economic growth based on comparative advantages, it is not enough to lead the economy toward the path of sustained long-term economic growth as the experience of the East Asian economies (Palma, 2019).
Acknowledgments
The author is indebted to Mrs. Elizabeth Jane Ho for assistance in English writing. This article is not part of any research project.
Notas al pie
1According to the data analysed, the sub item with the biggest share in the item of Transport Equipment is the Automotive vehicle for Freight Transport, followed by Trucks, Containers and Cranes. ↩
Referencias Bibliográficas
Barro, R. J. (1996). Determinants of Economic Growth: A Cross-Country Empirical Study (Working Paper 5698; Working Paper Series). National Bureau of Economic Research. https://doi.org/10.3386/w5698
Bielschowsky, R. (2009). Sesenta años de la CEPAL: estructuralismo y neoestructuralismo [Sixty years of ECLAC: Structuralism and neo-structuralism]. Revista CEPAL. PDF
Blomström, M., Kokko, A., & Sjöholm, F. (2002). Growth & Innovation Policies for a Knowledge Economy. Experiences From Finland, Sweden & Singapore. EIJS Working Paper Series, Article 156. https://ideas.repec.org//p/hhs/eijswp/0156.html
Bradford de Long, J., & Summers, L. H. (1991). Equipment Investment and Economic Growth. The Quarterly Journal of Economics, 106(2), 445–502. https://doi.org/10.2307/2937944
Bradford de Long, J., & Summers, L. H. (1992). Equipment Investment and Economic Growth: How Strong is the Nexus? Brookings Papers on Economic Activity, 1992(2), 157–211. https://doi.org/10.2307/2534583
Brahmbhatt, M., Canuto, O., & Vostroknutova, E. (2010). Dealing with Dutch Disease. https://hdl.handle.net/10986/10174
Cárdenas, M. (2005). Crecimiento económico en Colombia: 1970–2005 [Economic growth in Colombia: 1970–2005]. Coyuntura Económica, 35 años, 49–59.
Chang, H.-J. (2007). State-Owned Enterprise Reform [Policy Notes]. United Nations, Department of Economics and Social Affairs. https://econpapers.repec.org/paper/unepnotes/4.htm
Chang, H.-J. (2010). 23 Things They Don’t Tell You about Capitalism (First published). Penguin.
Decreto 444 de 1967. (1967). Por el cual se dictan normas sobre el régimen de cambios internacionales [Decree 444 of 1967]. Diario Oficial No. 32.143. https://www.suin-juriscol.gov.co/viewDocument.asp?id=1098286
Departamento Administrativo Nacional de Estadística [DANE]. (2024). Cuentas nacionales [National accounts]. https://www.dane.gov.co/index.php/estadisticas-por-tema/cuentas-nacionales
Documento CONPES 2494. (1990). Decisiones sobre el programa de apertura económica. Departamento Nacional de Planeación. Gobierno de Colombia. PDF
Domar, E. D. (1946). Capital Expansion, Rate of Growth, and Employment. Econometrica, 14(2), 137–147. https://doi.org/10.2307/1905364
Fagerberg, J. (1994). Technology and International Differences in Growth Rates. Journal of Economic Literature, 32(3), 1147–1175.
Fantom, N. (2016). The World Bank’s Classification of Countries by Income. World Bank. https://documents1.worldbank.org/curated/en/408581467988942234/pdf/WPS7528.pdf
Feenstra, R. C., Inklaar, R., & Timmer, M. P. (2015). The Next Generation of the Penn World Table. American Economic Review, 105(10), 3150–3182. https://doi.org/10.1257/aer.20130954
Garay, L. J., Quintero, L. F., Villamil, J. A., Fatat, A., Gómez, S., Restrepo, E., & Yemail, B. (1998). Colombia: Estructura industrial e internacionalización 1967–1996 [Colombia: Industrial structure and internationalization 1967–1996] (Vol. 29). Departamento Nacional de Planeación.
García García, J., López Valenzuela, D. C., & Montes Uribe, E. (2020). Porqué Colombia no exporta más [Why Colombia does not export more] (Borradores de Economía No. 1139). Banco de la República de Colombia. https://doi.org/10.32468/be.1139
González, J. (2016). Contabilidad asimétrica de las reservas [Asymmetric accounting of reserves]. Innovar, 28(68), 85–100. https://doi.org/10.15446/innovar.v28n68.70468
GRECO (Grupo de Estudios del Crecimiento Económico Colombiano). (2004). El crecimiento económico colombiano en el siglo XX: aspectos globales [Economic growth in Colombia during the twentieth century: global aspects] (Borradores de Economía No. 134). Banco de la República de Colombia. PDF
Guerrón Quintana, P. A. (2013). Common and idiosyncratic disturbances in developed small open economies. Journal of International Economics, 90(1), 33–49.
Harrod, R. F. (1939). An Essay in Dynamic Theory. The Economic Journal, 49(193), 14–33. https://doi.org/10.2307/2225181
Kagami, M. (1995). The role of industrial policy: Japan’s experience. Brazilian Journal of Political Economy, 15, 121–136. https://doi.org/10.1590/0101-31571994-0670
Kaldor, N. (1957). A Model of Economic Growth. The Economic Journal, 67(268), 591–624. https://doi.org/10.2307/2227704
Kaldor, N. (1961). Capital Accumulation and Economic Growth. In F. A. Lutz & D. C. Hague (Eds.), The Theory of Capital: Proceedings of a Conference held by the International Economic Association (pp. 177–222). Palgrave Macmillan UK. https://doi.org/10.1007/978-1-349-08452-4_10
Lall, S., & Teubal, M. (1998). “Market-stimulating” technology policies in developing countries: A framework with examples from East Asia. World Development, 26(8), 1369–1385. https://doi.org/10.1016/S0305-750X(98)00071-0
Mahalanobis, P. C. (1953). Some Observations on the Process of Growth of National Income. Sankhyā: The Indian Journal of Statistics (1933-1960), 12(4), 307–312.
Martínez Ortíz, A., & Ocampo, J. A. (2011). Hacía una política industrial de nueva generación para Colombia. FEDEPALMA.
Ocampo, J. A. (2014). Latin American structuralism and production development strategies. In J. M. Salazar-Xirinachs, I. Nübler, & R. Kozul-Wright (Eds.), Transforming economies. Making industrial policy work for growth, jobs and development (pp. 41–63). UNCTAD. PDF
Ortiz, C. H., Uribe, J. I., & Vivas, H. (2009). Transformación industrial, autonomía tecnológica y crecimiento económico: Colombia, 1925–2005 [Industrial transformation, technological autonomy, and economic growth: Colombia, 1925–2005] (Archivos de Economía No. 5283). Departamento Nacional de Planeación. PDF
Ortiz Quevedo, C. H., & Vásquez Castro, L. M. (2007). Aprendizaje manufacturero, dependencia tecnológica y crecimiento económico: El caso colombiano [Manufacturing learning, technological dependence, and economic growth: The Colombian case]. Sociedad y Economía, 12, Article 12.
Palma, J. G. (2019). Desindustrialización, desindustrialización “prematura” y “síndrome holandés” [Deindustrialization, “premature” deindustrialization, and the “Dutch disease”]. El Trimestre Económico, 86(344), Article 344. https://doi.org/10.20430/ete.v86i344.970
Poveda Ramos, G. (1997). Hacia una nueva industrialización [Toward a new industrialization]. Revista Institucional UPB. Universidad Pontificia Bolivariana. https://repositorio.accefyn.org.co/handle/001/1329
Prebisch, R. (1973). Problemas teóricos y prácticos del crecimiento económico [Theoretical and practical problems of economic growth]. Santiago de Chile: United Nations Economic Commission for Latin America and the Caribbean (ECLAC/CEPAL).
Prebisch, R. (1988). Dependence, interdependence and development. Cepal Review, (36), 205–212.
Riveros, L. (1984). Structural elements of the industrial recession in Colombia. Cuadernos de Economía, 6(6), Article 6.
Smith, A. (2002). An Inquiry into the Nature and Causes of the Wealth of Nations. In N. Woolsey Biggart (Ed.), Readings in Economic Sociology (pp. 6–17). John Wiley & Sons, Ltd.
Smith, K. H. (2007). Innovation and growth in resource-based economies. Competing from Australia, 58. https://figshare.utas.edu.au/articles/journal_contribution/Innovation_and_growth_in_resource-based_economies/23202140/1
The Conference Board. (2023). Total Economy Database—Key Findings. https://www.conference-board.org/data/economydatabase
Thirlwall, A. P. (1979). The Balance of Payments Constraint as an Explanation of International Growth Rate Differences. BNL Quarterly Review, 32(128), 45–53.
Thirlwall, A. P. (2012). Balance of Payments Constrained Growth Models: History and Overview. In E. Soukiazis & P. A. Cerqueira (Eds.), Models of Balance of Payments Constrained Growth: History, Theory and Empirical Evidence (pp. 11–49). Palgrave Macmillan UK. https://doi.org/10.1057/9781137023957_2
![]() Este artículo se publica bajo los términos de la Licencia Creative Commons Atribución-No Comercial-SinDerivadas 4.0 Internacional (CC BY-NC-ND 4.0).
Este artículo se publica bajo los términos de la Licencia Creative Commons Atribución-No Comercial-SinDerivadas 4.0 Internacional (CC BY-NC-ND 4.0).