Design of School routes using a Heuristic Model programmed in Visual Basic
Diseño de Rutas Escolares a través de un Modelo Heurístico programado en Visual Basic
Artículos
Recibido: 26/04/2021
Aprobado: 31/05/2021
Autores
Oscar J. Herrera
Paula A. Bedoya
Andrés F. Forero
Abstract
Nowadays, the effectiveness of transport management systems must not only provide an optimization of the evaluation indices of the system, but also, allow a much more dynamic and reliable control in the decision-making process. Thus, the present work studies an approach to design a routing model for operation logistics in school transportation companies in Bogotá, Colombia by means of a heuristic method as a solution technique. Such method is more flexible than the exact ones since it allows to incorporate difficult-to-model conditions. The Clarke and Wright algorithm, developed in Visual Basic, is the model used which was applied as case study to the student pick-up and drop-off system in the company Trans 2000uno Ltda., in Bogotá. The implementation of the heuristic method shows significant differences compared to an optimization model. Even though there is a slight increase in traveled distances, total times decreased since high traffic paths are avoided.
Resumen
Hoy en día la efectividad de los sistemas de gestión del transporte debe no solo generar una optimización de los índices de evaluación del sistema, sino que, además, permitir un control en la toma de decisiones mucho más dinámica y segura. Por ello, en el presente trabajo se aborda el diseño de un modelo de ruteo para la operación logística de empresas de rutas escolares en Bogotá Colombia a través de una heurística como técnica clásica de solución; dicho método es más flexible que los métodos exactos ya que permiten incorporar condiciones que son difíciles de modelar. El modelo utilizado es el algoritmo de Clarke y Wright el cual fue aplicado como estudio de caso al sistema de recogida y entrega de estudiantes de la empresa Trans 2000uno Ltda., en la ciudad de Bogotá y desarrollado a través del programa Visual Basic. La implementación de esta heurística muestra que se obtienen diferencias considerables en comparación con un método de optimización, donde se presenta un pequeño aumento en las distancias, pero con disminución en los tiempos de recorrido, esto ya que se evitan trayectos de alta congestión.
1. Introduction
Today, with increasing competitiveness among companies, one of their objectives is the resource optimization and the improvement of their techniques, in production and/or services and distribution as well; being the latter one of the most frequent problems due to lack of organization, technology development, or problems at the decision-making stage. Therefore, in order to have an efficient distribution logistics management, an adequate set up of the network is required, involving all actors of the activity in such a way that customers can be provided with high quality standards and services [1]. Thus, the efforts should be focused on using techniques and technological tools for operations management at all levels, especially emphasizing on distribution logistics, so costs may be reduced and the service promise improved. For this, the use of mathematical techniques for modeling the systems for optimization, whose objective is to minimize costs of transport and product handling is vital to achieve a good performance of the supply chain [2].
In addition, big cities face vehicle traffic conditions that turn out to be chaotic most of the time due to, among other causes, the increase of vehicle fleet, because there is no proper planning that takes into account the social impact of urban mobility on the transport systems, transforming them into troublesome issues [3]. On the other hand, there is a need for transporting people between different places in the city, so that specialized people transportation companies are used, (e.g., urban school busses among others), which need to set the routes of their vehicle fleet as a paramount part of their logistics management [4].
In this way, the purpose of the following work is to develop an improvement on the effectiveness of the student pick-up and drop-off operations in one school transportation company in Bogotá city, mainly minimizing the time spent by their vehicle fleet. This would benefit the actors involved in the deployment of this operation (the students and their families, the school and the company itself). Additionally, with the contribution provided in this study, a solution from a social viewpoint to relieve the stress in the customers of this company service may be presented, besides the contribution to improve the mobility in some areas of the city
2. Methods
The following Figure 1, illustrates the steps done during the development of this work, starting with the definition of the needs of the company to improve the routing planning of its vehicle fleet up to the final outcomes.
Figure 1
Procedure for the development of the project
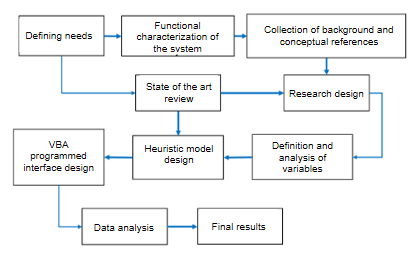
In this way, a correlational descriptive analysis was developed characterizing the route planning system until defining the model that was best suited to carry out this activity. For this purpose, a review of the state of the art, a research design, and the definition of the most relevant variables in the operation of routes were taken into account.
3. Conceptual references of the transportation logistics and the Vehicle Routing Problem
Logistics is what inherently adds value to different products consumed daily, it is linked to the supply chain, and describes the way products and raw materials are taken from suppliers to manufacturers, and from these manufacturers to the customers. Its aim is to integrate the supply chain, generating competitive advantages, with lower costs inherent to the activity and lower prices that fit the market [5]. Besides, transport is related to logistics in that it represents the most relevant element regarding its costs. Moving goods from its production site to the final customer and the provision of the transport service as a whole, has a high impact on the cost of the product since it includes the transfer rate of the goods between two points, additional charges for collecting the goods at the point of origin and / or delivery to the destination point, insurance of the goods to be transported, fuels, maintenance, depreciation of the vehicle, among others [6].
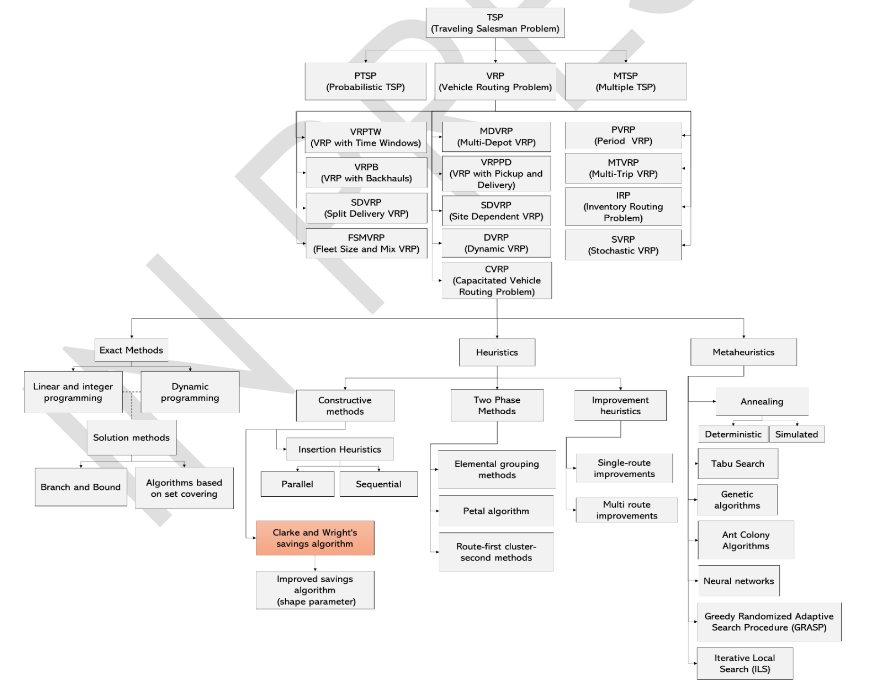
Moreover, the optimization allows a much more dynamic and reliable control in the decision-making process [7]. The problem of vehicle routing (Vehicle Routing Problem - VRP) determines the optimal set of routes that a fleet of vehicles must take to service a specific set of customers [8]. The evolution of the VRP since its origin with the TSP, as one of the most common problems in terms of logistics optimization, presents a series of branches such as Exact, Heuristic and Metaheuristic Methods, which can be seen in Figure 2:
The exact methods involve defining all possible solutions to a problem and looking for the optimal one. These methods are efficient for problems having up to 50 destinations approximately, but if this amount is exceeded, it will take a lot of computational time to execute [8], [9]. On the other hand, heuristics are approximate methods in which the solutions found are of acceptable quality, and sought within a limited search space [9], [10]. Finally, metaheuristics are approximate methods useful to solve high-complexity combinatorial optimization problems; when heuristic methods are not enough, metaheuristics are used. These combine different concepts, including, but not limited to, artificial intelligence and biological evolution [11].
Figure 2
Concept map of VRP types and solution methods
3.1. Background
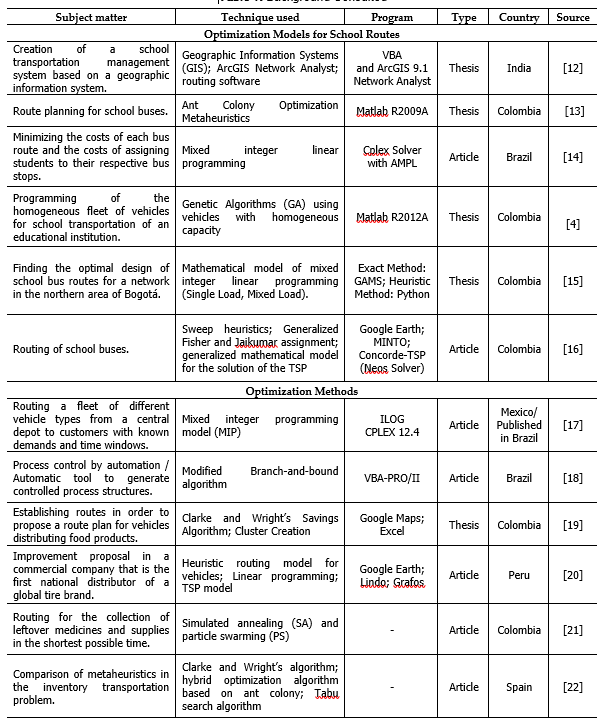
Table 1 shows the information consulted in different articles and undergraduate and master thesis about the vehicle routing problem under different solution methods.
Table 1
Background Consulted
4. Characterization of the System and its problem
Trans2000uno Ltda., is a company located in Bogotá operating specifically in the center-west of the city and is responsible for managing school routes, currently moving 149 students with 13 routes total. In this way, it transports approximately 12 students per route, having an underutilized capacity of 33.3%. Additionally, the company provides the school route service mostly to students located at the district areas named Fontibón (65%) and Kennedy (21%). Most of the students belong to the fourth, eighth and seventh grades; 52% of the students transported are in high school and the remaining 48% in elementary school. It is noteworthy that the company also provides the service for kindergarten and preschool children, who are the population that demands most of the attention and care during transport due to their vulnerability.
Regarding the planning of the routing operation, this is done by a driver who performs the function of director of operations, who in the first place enters the data of the students into an Excel spreadsheet. After this, he/she types the data in the Google Maps application with the purpose of locating the addresses and determining the distances between each of the students to pick up. Subsequently, according to his or her experience, he or she allocate the students to the available routes. Following this way of planning the routing, it is evident that difficulties in the mobility in Bogotá due to huge traffic jams at rush hours affect the performance of the company Trans2000uno. These facts justify searching for a quantitative method that improves, and at the same time, ease the designing process of the route for available vehicles. The new routing method may represent for the company a lower consumption of resources (time, labor, money, etc.) in the deployment of the operations and greater satisfaction to its customers.
Therefore, a heuristic technique called Savings Algorithm was evaluated and developed through Visual Basic. This is a classic method that is currently widely used since it gives better results than other types of heuristics as mentioned in [22]. Additionally, it can incorporate other types of restrictions that are usually more difficult to model through an exact optimization technique [23]. Likewise, the present work contributes to the reduction of the time and distance traveled in the transportation of students, improving their route as well as favoring their well-being, and lastly, to a significant reduction in the planning times of the logistics transport operation for the company Trans2000uno Ltda.
5. The Model
The model to be established, in this case the Clarke and Wright’s savings algorithm, is more flexible than the exact ones since it allows to incorporate difficult-to-model conditions [24], and is mostly applied in problems where the number of vehicles to be used is a decision variable [25]. In this algorithm, savings in distance are calculated for different routes joining different combinations of nodes. Based on [26], if there are two different routes, they can be combined to form a new one, with the purpose of generating savings (in distance), which is given by: S_ij=C_i0+C_0j-C_ij
This algorithm is based on an initial solution and connections that give greater savings are made, without breaking the restrictions of the problem. The savings algorithm has two versions: parallel and sequential. The first one is described as follows:
Initialization: for each customer i build the route (0,i,0)
Savings computation: Calculate S_ij for each pair of customers i and j
Best link: Let S_(i^* j^* )=max S_ij where the maximum is taken from the savings not considered yet. Let r_(i^* ) and r_(j^* ) be the routes containing the customers i^* and j^*. If i^* is the last customer of r_(i^* ) and j^* is the first customer of r_(j^* ) and the combination of r_(i^* ) and r_(j^* ) is feasible, combine.
Delete S_(i^* j^* ) from future considerations
If there are savings left to examine, execute item 3, stop otherwise.
In some cases, the original savings equation can generate circular routes, which is negative. The following equation regarding the above has been proposed: S_ij=C_i0+C_0j-〖λC〗_ij
λ is a parameter that restricts the union of routes with distant customers.
For the application of this algorithm in the school routes of the studied company, and based on the established data, the route design for the district areas having the highest concentration of students (Fontibón and Kennedy) was taken as an application case. It is worth mentioning that this algorithm was applied through an interface programmed in Visual Basic for Applications (VBA). This tool allows the information used by the heuristics to be systematized and it can be easily implemented by the company in order to adapt to the inherent changes in the planning of the routing every semester. These changes are attributed to the inherent dynamics of the system when the students register in or quit from school, change of address, etc.
Figure 3 below details the use of this tool for the application of the savings algorithm by means of a decision flow diagram where the sequence of steps to be followed, for the definition of the routes in the Trans2000 company, is specifically demonstrated.
Figure 3
Flowchart of the Savings Algorithm Programmed in Visual Basic
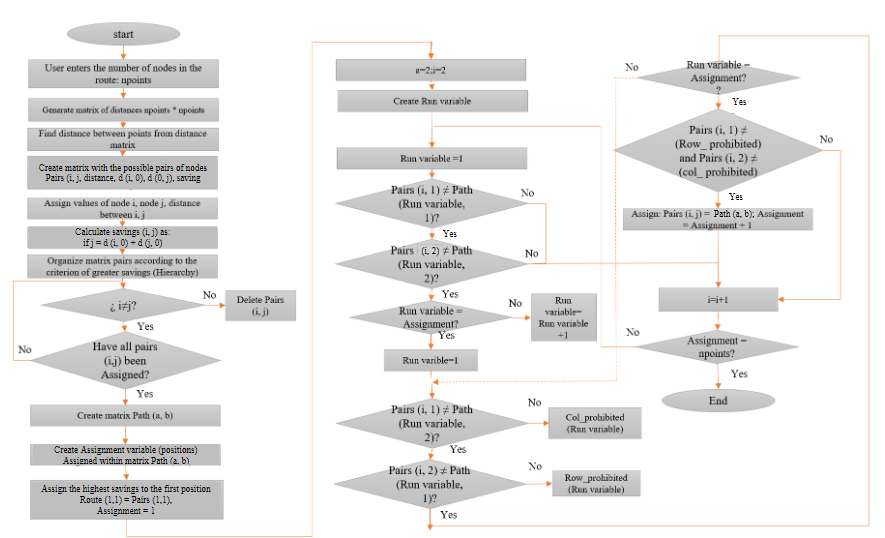
As it is shown, the first thing is to enter the number of nodes that the route contains (picking-up or drop-off points for students). For this, the exact address of each of these points is entered in the registration form to then generate the distance matrix that is the base with which the savings algorithm works. This step process was automated, where data must be verified to fully comply with the requirements of the search platform (google cloud platform) in order to avoid errors and, in this way, establish all distances and/or times between the points that were taken as customers from the beginning. This sequence is described in Figure 4 below.
The second step is to calculate the distances between the different points with respect to the origin, that corresponds to the location of the school, and between them (pair of points or customers) in order to subsequently apply the computation of distance or time savings, which is shown in Figure 5. Thirdly, the set-up of the route is basically done by taking as a criterion the pair of points with the greatest savings and forming the sequence with the next greater savings and where some of the previously selected points are not repeated. This is performed iteratively to cover all the points established to form the final route. Please note that all the points that make up this route, are part of a group previously segmented by neighboring areas or sub-zones of the city characterized by being nearby and not presenting transfer inconveniences between them due to conditions of road obstruction and/or high traffic congestion, besides fulfilling the capacity of the respective vehicle to be assigned.
Additionally, it is important to highlight that the distances between each of the points in several cases are asymmetrical, that is, the distance to go from point i to j is different from the distance to go from point j to i (d_ij ≠ d_ji) [27]. An estimated average speed of 23.3 km/h was also established in order to compute the travel time of the routes between the school and the points, and between those points, in the areas covered by the routes with a limit number of students in each vehicle kept at 18.
Figure 4
Diagram for obtaining distances and times
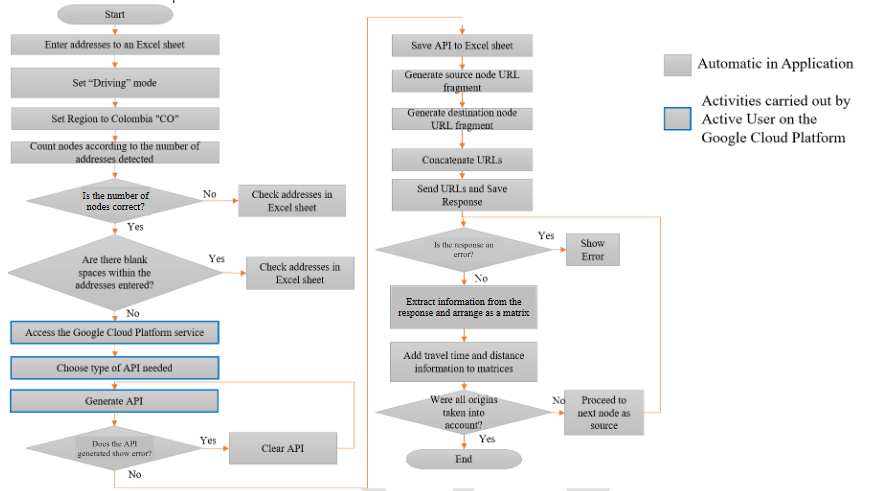
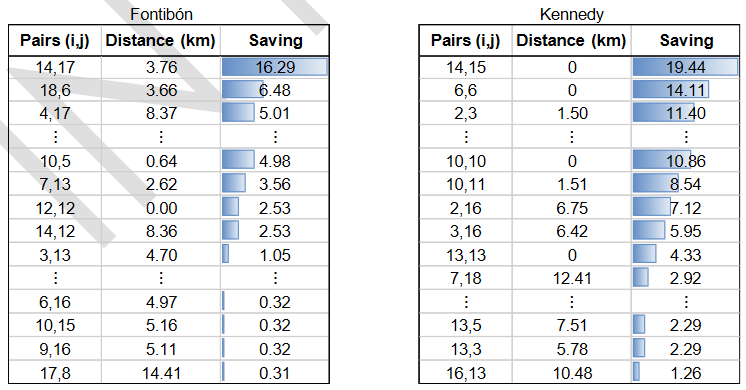
Figure 5 describes what was mentioned above in step two, shows the two district areas (Fontibón and Kennedy) of greater student concentration the company has to cover picking-up and dropping-off, and the values of the savings by pairs of some points. It is worth noting that for each of these areas there were 324 pairs as a result of the combinations after having 18 points or nodes to be traveled by zone.
Figure 5
Savings and Distance between pairs evaluated for the Fontibón and Kennedy district areas
6. Results
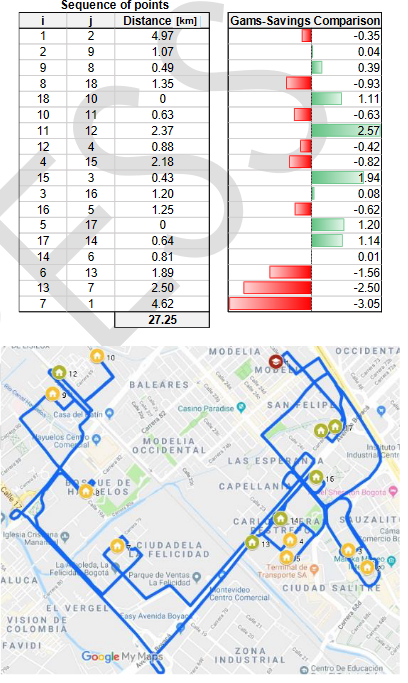
When developing the savings algorithm for the Fontibón and Kennedy district areas through an interface programmed in Visual Basic for Applications (VBA), the most appropriate routes for the company were established in such a way that the distance traveled was minimized, taking into account restrictive aspects such as crossroads, that due to high traffic should not be followed. In addition, these results were compared with an optimization technique based on pure binary programming such as the TSP (Traveling Salesman Problem) model, which was developed in the software GAMS 23. These results are observed in Figure 6 for the Kennedy area, where the route on the map is highlighted, the orange points or nodes are those established as the one-way sequence from the school (green dot), and those in blue represent the path back to school.
Figure 6
Route map for the Kennedy area and its comparison with the TSP model (in Gams)
As it can be seen, the negative values (red color) outnumbered the green ones, which means that an average distance of 2.4 km exceeds the outcome of the Savings Model with respect to the optimization model. The same behavior is shown for the Fontibón area, which can be seen in Figure 7
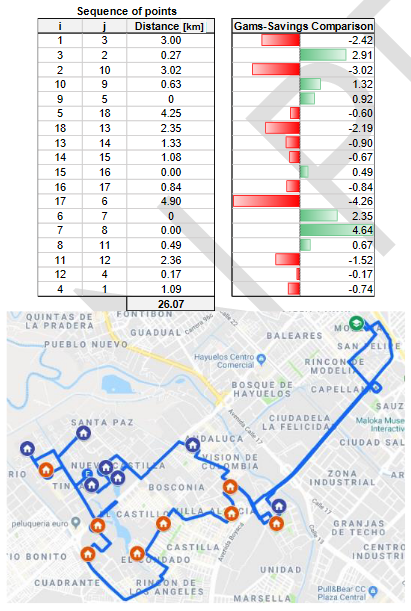
Figure 7
Route map for the Fontibón area and its comparison with the TSP model (in Gams)
The route in Figure 7 is highlighted on the map; yellow points or nodes are those established as the one-way sequence from the school (red dot), and those in green represent the path back to school. In the same way as in the Kennedy area, there are more negative values (red color), which means that an average distance of 4 km exceeds that of the Savings Model with respect to the optimization model.
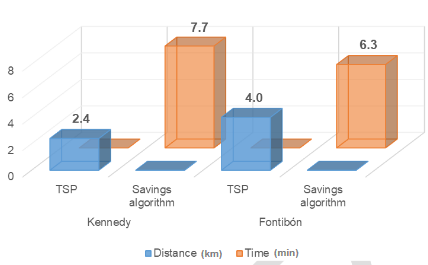
These differences may have resulted due to the fact that in the Savings Model other sequence options were chosen between points. This was done because restrictions of high traffic routes were taken into account since travels occur at peak traffic times in the city. Consequently, although this model does not generate the shortest distance, it does show a shorter transfer time. This can be seen in Figure 8 where there is a shorter transfer time for both routes evaluated, although the distance is greater.
Figure 8
Advantages in Distances (km) and Times (min) between TSP and Savings models for the evaluated areas
7. Conclusions
The computational application for the development of the savings algorithm allowed to perform iterations and arrangements in order to obtain the greater savings in distances and times between the different students’ pick-up points that the transport company has to cover. Later on, the possible routes that minimize such parameters are evaluated under a specific order without exceeding the capacity of the available fleet. In this way, it was established that the use of this model saves an average of 10.4% of the time compared to the routes evaluated in this work, but the distance was 12.2% higher compared to the outcome distances when using a classic Optimization Model. This situation is mainly due to the fact that the sequence established by the Optimization Model does not take into account delaying aspects due to vehicular congestion on certain city routes. These aspects can be included in Visual Basic with the Savings Model, leading to more efficient and faster travels, although with a little more distance to cover.
Consequently, the use of this application is much more appropriate than conventional optimization models in terms of the behavior dynamics of the type of system considered in this work, specifically, by the complexity of incorporating traffic factors, among others. More generally, it can be concluded that the application developed allows to achieve very good and recommended results for the logistics planning of the operation of the companies under study in a very short computational time, reducing the algorithmic difficulty involved in the use of other techniques, like classic optimization models.
Besides, regarding the use of the application, the following ideas are concluded: a) The savings algorithm was developed in the Visual Basic programming environment for Excel Applications, since it is a Microsoft Office software, which people are more familiar with, for planning the routes operation in the company under study; b) Having access to Google Maps allows to obtain accurate travel distance data between stops in the “Driving” mode, additionally, travel times between locations can be obtained, what would eventually allow to calculate the speed between points; c) Although access to a Google Cloud Platform API key requires an investment for this service (between 4 and 5 dollars for 500,000 origin-destination pairs), it allows to obtain a large volume of distance and time information through the service “Distance Matrix”, along with access to other services such as “Directions”, “Geolocation” among others. This investment becomes justifiable as the data set offered increases with volume discounts on the platform.
Referencias
- M. Musavi y A. Bozorgi-Amiri, «A multi-objective sustainable hub location-scheduling problem for perishable food supply chain,» Elseivier, pp. 766-778, 2017.
- D. Mogale, S. K. Kumar y M. K. Tiwari, «An MINLP model to support the movement and storage decisions of the Indian food grain supply chain,» Control Engineering Practice, nº 70, pp. 98-113, 2018.
- P. Riquelme, G. Gatica y E. Orozco, «Diseño de un modelo de operación para ruteo de transporte urbano basado en simulación discreta,» Investigación e Innovación en Ingenierías, pp. 1-12, 2015.
- Q. K. Caicedo, Ruteo Y Programación Del Transporte Escolar En Flota Homogénea Desde Su Domicilio Hasta La Institución Mediante Algoritmos Genéticos, Cali: Repositorio De La Universidad Del Valle ;Escuela De Ingeniería Industrial, 2015.
- J. M. Gómez Aparicio, Gestión logística y comercial, Madrid, España: McGraw-Hill/Interamericana de España, S.L., 2013.
- R. H. Ballou, Logística Administración de la cadena de suministro, México: Pearson Educación de México, S.A., 2004.
- J. R. Montoya, «Planeación del transporte y enrutamiento de vehículos en sistemas de producción,» Ingeniería y Desarrollo, pp. 85-97, 2003.
- P. Toth y D. Vigo, THE VEHICLE ROUTING PROBLEM, Bologna, Italia: SIAM ( Society for Industrial and Applied Mathematics), 2002.
- M. L. B. Rocha, L. R. E. C. González y C. J. A. Orjuela, «Una revisión al estado del arte del problema de ruteo de vehículos: Evolución histórica y métodos de solución,» INGENIERÍA, vol. 16, nº 2, pp. 35-55, 2011.
- S. N. Jahromi, M. Rashidinejad y A. Abdollahi, «Multistage distribution network expansion planning under smart grids environment,» Electrical Power and Energy Systems, pp. 222-230, 2015.
- Universidad Politécnica de Valencia, «Universidad Politécnica de Valencia,» 22 02 2015. [En línea]. Available: https://optimizacionheuristica.blogs.upv.es/2015/02/22/que-son-las-metaheuristicas/.
- M. A. Khader Nayati, School Bus Routing and Scheduling using GIS, Gävle, Suecia: University of Gävle, 2008.
- J. S. Arias Rojas, Aplicación De Un Modelo De Optimización En La Planeación De Rutas De Los Buses Escolares Del Colegio Liceo De Cervantes Norte, Bogotá: Repositorio Pontificia Universidad Javeriana, 2010.
- S. N. D. Araya, N. C. E. Obreque y B. G. E. Paredes, «Un Modelo De Programación Lineal Entera Mixta Para El Problema De Ruteo De Vehiculos En El Transporte Escolar,» Congreso Latino-Iberoamericano de Investigación Operativa; , pp. 2293-2302, 2012.
- G. R. Rodríguez Parra, Optimización del Problema de Ruteo y Programación de Buses Escolares con Restricciones de Congestión de Tráfico para Políticas de Rutas Compartidas (Mixed-Load) e Independientes (Single-Load), Bogotá D.C: Repositorio de Escuela Colombiana de Ingeniería Julio Garavito, 2017.
- M. D. F. Escobar, C. J. E. Gaviria y C. J. P. Orejuela, «Método de tres fases para la solución del ruteo de buses escolares,» Espacios, vol. 39, nº 50, 2018.
- R. L. A. Infante y I. S. Litvinchev, «Routing vehicles in a special transportation network,» 6th IFAC Conference on Management and Control of Production, pp. 385-387, 2013.
- S. K. Silva, S. B. Villar, A. B. Da Costa, H. C. G. Teixeira y A. C. B. Araújo, «Development And Application Of An Automatic Tool For The Selection Of Control Variables Based On The Selfoptimizing Control Methodology,» Brazilian Journal of Chemical Engeneering, vol. 34, nº 03, pp. 851-871, 2017.
- R. J. Álvarez Hernández, Propuesta De Solucion Al Problema De Ruteo De Vehiculos En El Operador Logistico Opperar S.A. Para El Transporte Y Distribucion De Productos Alimenticios Secos Del Grupo Nutresa S.A., Bogotá D.C: Repositorio Universidad Distrital Francisco José de Caldas, 2017.
- W. Atoche y S. Rodriguez, «Heuristic Model In The Determination Of The Daily Route Of Delivery Of Merchandise Using Routing Of Vehicles With Load Capacity,» 16th LACCEI International Multi-Conference for Engineering, Education, and Technology: “Innovation in Education and Inclusion, pp. 1-5, 2018.
- R. A. Gómez, F. Salazar y N. Rincón, «Metaheurísticos para Solución del Problema de Ruteo en la Recuperación de Medicamentos Sobrantes y Suministros en Hospitales,» Información Tecnológica, vol. 30, nº 2, pp. 303-314, 2019.
- A. Esparcia Alcázar, A. Martínez García, J. Merelo, P. García Sánchez, E. Alfaro Cid, M. Cardós y S. Ken, «Comparación de heurísticas de resolución del VRP y enfoques multi y monoobjetivo para el problema de transporte de inventario,» VI Congreso Español sobre Metaheurísticas, Algoritmos Evolutivos y Bioinspirados, pp. 131-138, 2019.
- O. J. Herrera Ochoa y I. D. Romero Fonseca, «Model of Transhipment and Routing Applied to the Cargo Sector in Small and Medium Enterprises of Bogotá, Colombia,» International Journal of Social, Behavioral, Educational, Economic, Business and Industrial Engineering, pp. 621 - 627, 2018.
- C. M. Contreras Pinto y M. F. Díaz Delgado, «Metodos Heuristicos para la solución de Problemas de Ruteo de Vehiculos con capacidad,» Universidad Industrial de Santander UIS, Bucaramanga, 2010.
- G. Nagy y S. Salhi, «Heuristic algorithms for single and multiple depot vehicle routing problems with pickups and deliveries,» European Journal of Operational Research, vol. 162, pp. 126-141, 2005.
- D. Fajardo, S. Ortiz, O. J. Herrera y A. Santis, «A comparative analysis of heuristic applied to collecting used lubricant oils that are generated in the city of Pereira, Colombia,» International Journal of Civil, Environmental, Structural, Construction and Architectural Engineering, pp. 1479-1487, 2016.
- H. A. Taha, Investigación de operaciones, México: Pearson Educación, 2012.