Hazard perception of novice drivers in mountain roads: a case study in Ecuador
Percepción del peligro del conductor novato en carreteras de montaña: un caso de estudio en Ecuador
Artículos
Recibido: 08/12/2020
Aprobado: 30/04/2021
Autores
Yasmany García-Ramírez
Wendy Cuenca
Abstract
Novice drivers are more likely to be involved in a traffic accident than experienced drivers. Detecting danger is one of the skills that these drivers must acquire with age and experience. This can reduce this probability, especially on mountain roads. Therefore, the purpose of this research was to analyze the hazard perception of novice drivers on mountain roads. Thirty-seven drivers participated in the experiment, who watched videos of road sites. After each video, they had to answer a survey about the hazards they observed on the site. Based on this survey, the hazard perception was estimated, which was compared with the actual hazard, calculated by iRAP. As expected, drivers do not recognize hazards properly, especially in the most dangerous places. No significant differences were found among sex, age, and type of driver's license. However, relationships were found among hazard perception, the actual hazard, and the error between them, so four linear equations were calibrated. This research will help public and private institutions related to road safety optimize resources in driver training by: a) including the hazard detection of danger in the curriculum, or b) offering a complementary course to those who have already obtained their license.
Resumen
Los conductores novatos tienen una mayor probabilidad de tener un siniestro vial que los conductores experimentados. Detectar el peligro es una de las habilidades que este tipo de conductores deben adquirir con la edad y la experiencia. Con ello se puede reducir esa probabilidad, especialmente en carreteras de montaña. Por lo tanto, esta investigación tuvo por objetivo analizar la percepción del peligro de los conductores novatos en carreteras de montaña. Treinta y siete conductores participaron en el experimento, a quienes se les mostraron videos que contenían sitios de carreteras. Luego de cada video tenían que responder una encuesta acerca de los peligros que observaron en el sitio. En base a esta encuesta se obtuvo la percepción del peligro, la cual fue comparada con el peligro real, obtenido mediante el iRAP. Como era de esperarse los conductores no reconocen los peligros adecuadamente, en especial en los sitios más peligrosos. No se encontraron diferencias significativas entre el sexo, edad y tipo de licencia del conductor. Pero, si se encontraron relaciones entre la percepción del peligro, el peligro real y el error entre ellas, por lo que se calibraron 4 ecuaciones lineales. Esta investigación ayudará a las instituciones públicas y privadas relacionadas con la seguridad vial a optimizar los recursos en la formación de conductores: a) incluyendo la detección del peligro en el currículum, o b) ofreciendo un curso complementario a quienes ya obtuvieron su licencia.
1. Introduction
Worldwide, 1.35 million people die annually, and another 50 million are injured due to road traffic accidents [1]. Most of these accidents occur in middle and low-income countries. In Ecuador, a middle-income country, in 2018, 2,151 people died, and around 20,000 were injured due to road accidents [2]. One of the principal causes of these accidents is the human factor. In this factor, novice drivers are those who have a higher number of accidents compared to experienced ones [3]. Further details about the cognitive, behavioral, and attitudinal characteristics that define those drivers, can be seen in [4].
Candidate drivers can quickly acquire the elemental skills of controlling the vehicle and learning about traffic laws. This learning can be achieved with only 15 hours of driving [5]. However, it takes them much longer to develop perceptual and cognitive skills to move safely in a road environment [3]. Lack of experience may be associated with problems such as overestimation of their own abilities, underestimation of dangers, and longing for excitement and sensation [4]. Also, the human mood can affect young drivers, resulting in risky driving behaviors like transient violations (e.g., speeding) and risky exposure (e.g., driving tired) [6]. Among the skills acquired through driving experience, hazard perception is the most explored [7].
Hazard perception is the ability to read the road [8]. This perception can impact the driver behavior on the roads [9]. Novice drivers, in contrast to experienced drivers, can detect fewer hazards [10], may take longer to react [11], may skip areas with potential dangers [12], or may have difficulty processing them [13]. This subjectivity may lead them to choose inappropriate actions [14] that can lead to traffic accidents. It is difficult for the novice driver to detect the dangers since it is a multidimensional and complex cognitive process [15], which can only be acquired through age and experience. For example, drivers should mainly keep the vehicle on the road. Besides, they must identify the possible dangers that could lead them to a traffic accident. They should rule out low or impossible hazards and focus on the most dangerous ones. This process is continuous along the route and generally occurs within a short time. When speaking of the dangers, it is understood that these come from sources that the driver can see, regardless of whether or not they are aware of their effects [7]. On mountain roads, this process is more complicated due to their design and operation restrictions. Ideally, the novice driver should have a hazard perception close to the actual hazard in order to drive safer.
The actual hazard is the objective measure of the danger, that is, what can increase the frequency and severity of traffic accidents. There are several tools to measure the actual hazard. One of them is the methodology proposed by iRAP [16]. This tool allows to classify, using stars (1 = worst, 5 = best), the probability of an accident occurring, and how serious it can be for pedestrians, cyclists, motorcyclists and vehicle occupants. This star rating is calculated based on the particular characteristics of a site and from the results of previous investigations of traffic accidents. For example, a highway with low operating speeds is less dangerous to vehicle occupants than one with higher operating speeds. A place without a crosswalk is less dangerous to pedestrians than another one with a crosswalk. This actual danger should fit in the perception of the drivers, which is difficult since it is a subjective measure that depends on each driver.
The hazard perception can be measured using various tools (more details in [17]). Photos [18], [19], videos [7], [18], [20], simulators [21], or real trips [22] have been used. A survey or an interview was employed to collect data on these tools, and also, more details could be obtained about the drivers. Despite a large amount of research performed worldwide, very little has been done in Latin America where there is an increasing number of traffic accidents [1].
In this scenario, the purpose of this research is to analyze the hazard perception of novice drivers on mountain roads. The experiments performed consisted in showing short videos of several road environments to the participants. Thirty-seven novice drivers participated in the study. To present the results of those experiments, the remainder of this paper is organized as follows. The Materials and methods section describes details of the analyses: driver and site selection, the survey and data collection, and processing. Then, the Results section discusses the perceived and objective hazard, and its errors. Finally, the last section presents the main conclusions of the study.
2. Materials and methods
This is an experimental investigation to assess hazard drivers' perception using videos of mountain roads. The data collection was conducted through online surveys due to restrictions by COVID-19 [23]. The surveys asked participants how dangerous the site was and why. After data collection, their answers were processed to get the study results.
2.1. Driver selection
Thirty-seven drivers participated in the study. From the sample, 16 were men, and 21 were women. The average age was 26.9 ± 1.27 (95% CI). Most drivers (78%) had a type B driver’s license, and the rest (22%) had a type C license. The first is obtained after a short formal instruction (33 hours)[24] and is called non-professional driver’s license, while the second is full instruction (480 hours), and it is called professional driver’s license [25]. Despite being a small sample, it is a relatively significant number, given the mobility restrictions due to the COVID-19 pandemic, in addition to the data collection method (videos). Regarding ethical approval, the participants read the information sheet about the research and filled the consent form. All of them were aware of the academic purpose of the study.
2.2. Site selection
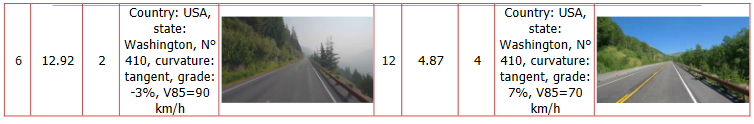
First, an analysis for the possible places that could be used in the experiment was performed. Most of the sites were from the Loja-Catamayo mountain road in Ecuador. A mountain video trip from the United States of America was also used to complete the test sites. As a result, 12 sites with 1-4 stars (according to iRAP) were chosen, as shown in Table 1. On the Ecuadorian road, videos were recorded with a camera located at the driver's eye height and from the driver's perspective. The camera was placed inside the windshield, avoiding interference with driving activities. The tour was made in favorable weather conditions and at a speed of around 60 km/h. The video of the US road was downloaded from the Internet considering that its conditions are similar to those of the road from Ecuador. The two complete videos were cut to have shorter videos covering the measurement site. These videos lasted approximately 10 seconds
table 1
Details of the selected study sites

2.3. Survey
The survey was adapted from [18] and developed in Google Forms [26]. Questions related to the twelve videos of the sites and about the drivers were included. Each video had two questions: a) how dangerous do you consider this site? and b) why? The first question had a scale from 0 to 10, where 0 was not dangerous at all, and 10 was very dangerous. In the second question, the answer should be justified, detailing the elements that they considered dangerous. The driver demographic information such as sex, type of license, and age were also collected in the survey. Before the questions, an introductory video was shown in order to explain the academic objective of the study, and the guidelines to follow during the survey. Previously, the survey was validated with few drivers. The items evaluated were the survey flow, the understanding of the questions, and how intuitive it was. After making adjustments to the survey, the data was collected.
2.4. Data collection and processing
The data collection was carried out between June and July 2020. The link of the survey was shared using social networks and driving school e-mail databases. Every video lasted 10 seconds. After 3 seconds, it showed a timer (3, 2, and 1) before the area to be evaluated. From seconds 7 to 10, the participant should analyze the site. A sound (clock sound) helped them know the beginning and the end of the analysis. After 10 seconds, the driver answered the two questions without any time limit. The participant was not allowed to watch the video again. Based on these observations, the drivers' hazard perception on each site was estimated. Their scores (0-10) were scale-converted to 5 to compare to the stars in iRAP. Otherwise, the objective hazard was estimated using ViDA software [27], which has the iRAP models and factors. Some characteristics were measured indirectly, such as the lane width (from the videos) or the operating speed (from calibrated equations) [28]. The hazard perception and its relation to the objective hazard were analyzed. Besides, the error in the evaluation of each driver was also evaluated. All these analyses were performed using Minitab 14.2 statistical software [29]. The main statistics used were: averages, student's t-test, and analysis of errors.
3. Results
3.1. Perceived and objective hazard
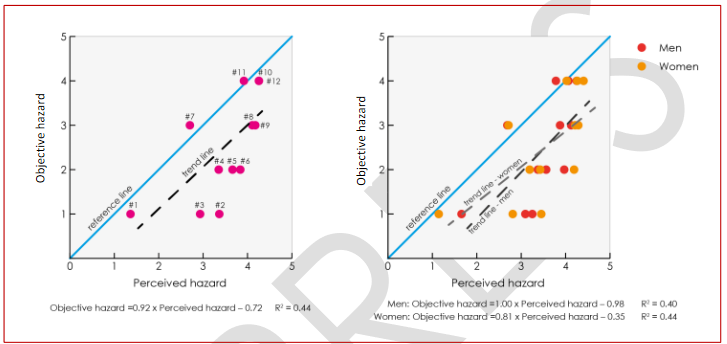
The perceived and objective hazard is shown in Figure 1. The graph on the left shows that novice drivers perceive the most dangerous sites (1 and 2) as less dangerous, which is one of the most critical conditions. There are also some sites in the medium hazard level (3 stars) where the danger was overestimated. In the least dangerous condition of this study (4 stars), novice drivers respond appropriately. Also, in this graph, the objective values match the perceived ones in sites 1, 7, and 11. Those sites clearly show their level of danger. Based on these data, a linear equation that estimates the objective hazard based on the perceived one was calibrated. Additionally, on the right graph, the hazard data were split by driver sex. In general, similar trends are observed among them and the whole sample. Linear equations for each sex were also calibrated. Based on these equations, men behave similarly to the whole sample group, while women tend to hit the most dangerous places, and to overestimate the least dangerous sites. These differences between the sexes should be studied in depth in future research. There were no trends between hazard perception and the type of license.
Figure 1
Perceived and objective hazard for the whole sample (left), and between women and men (right)
3.2. Hazard perception error analysis
The Mean Absolute Percentage Error (MAPE) was used to analyze the errors made by each novice driver between the objective hazard and their perception. The average MAPE for each site was also calculated. With these values, average MAPE for each star, the standard deviation, and the confidence interval (95%) were calculated, as shown in Table 2. The average MAPE, as well as its standard deviation, decreases as the number of stars increases, which was previously observed in Figure 1. Individual and average MAPE is plotted in Figure 2. The left graph related the age of the driver and sex, while the right graph included the objective hazard. First of all, there is no trend between errors, the driver's age, and their gender. The average for male drivers is 2.38%, and for women, it is 2.35%. There is no statistically significant difference between men and women errors (p-value = 0.90) using the Student's t-test. The right graph shows a clear trend, so a linear equation was calibrated. This equation shows that the errors are highest for the lower stars and vice versa. It also helps calculate the average error for each star.
Table 2
Details of the calculated average MAPE (%) per star
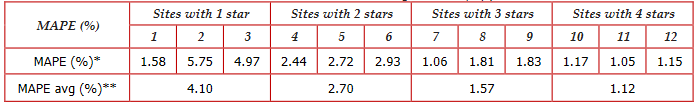

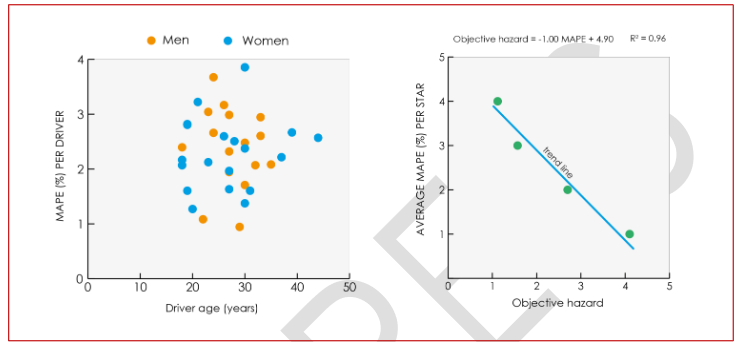
Figure 2
MAPE per driver versus their age and sex (left), and MAPE per star versus objective hazard (right)
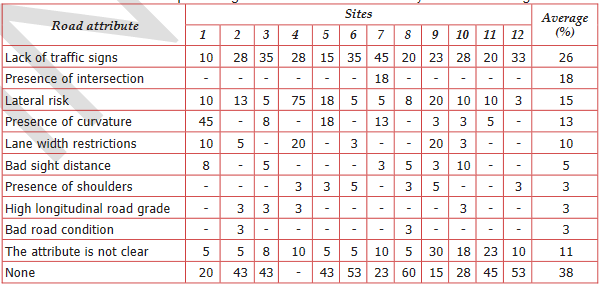
In addition, the road attributes considered as dangerous by novice drivers are shown in Table 3. In all the sites, the main attribute that is recognized is the lack of traffic signs, followed by the lateral risk, and some other noticeable elements such as curvature. Some also acknowledged the presence of roadside hazards, which is common in mountain environments. These results show that there are some deficiencies in training. Currently, the training is based mainly on the vehicle handling and the knowledge of traffic laws. These concepts should combine with the elements related to the driver and the road. A large number of answers did not find any dangerous feature, which is also worrisome, given that on mountain topographies, users are always exposed to some danger.
Table 3
Driver answer percentages for road attributes that they considered dangerous
4. Conclusions
This paper aims to analyze the hazard perception of novice drivers on mountain roads. Twelve road sites were presented in short videos to 37 novice drivers. The videos showed mountain roads from Ecuador and the United States of America. The hazard perception was compared to the objective hazard by iRAP star rating. After analyzing the results, the main conclusions are presented.
Novice drivers (men and women) do not correctly detect hazards in the most dangerous places (1 and 2 stars), as well as in the sites with a medium level of danger (3 stars). The perception improves in less dangerous places (4 stars). These trends were also found in the previous literature [18]. This can be explained using a previous study [19], where 90% of drivers, regardless of their experience, detect high threat objects placed on the side of the road. However, experts can identify a higher number of medium threat objects than novice drivers (55% of expert drivers versus 40% of non-expert drivers); while novices detect low threat objects (almost 20% of non-expert compared with none for the expert drivers). Therefore, proper object detection and prioritization could be achieved through training rather than years of experience. On the other hand, the errors between objective and subjective hazards were not statistically different between men and women. There was also no trend regarding the age of novice drivers. The mean errors for each star had a significant inverse relationship to the objective hazard. Errors are bigger in more dangerous locations and decrease as the hazard decreases. Several equations were calibrated, and these could help in future studies, for example by relating them to traffic accidents with these types of drivers.
Regarding the road attributes, novice drivers mainly detect hazards with horizontal or vertical traffic signs. A lower percentage of them also found hazards at the roadside, which are related to the crash severity. Many of them did not find any dangerous attributes in the sites which are impossible on this type of road. These results show that there is a need to improve the novice driver training process, including elements related to the driver and the road itself. Drivers indeed learn to detect hazards more effectively with increasing age and experience, but it is necessary to include formal education to try to accelerate that process.
This study has several limitations. First, it only had 37 novice drivers, yet the sample has a similar number of male and female participants. It was performed using videos and through on-line mode; however, through this method, resources can be saved and compared to real trips. Besides, this method is safer since the driver is not exposed to a crash accident during the collection of data. Despite these limitations, this research deepens the understanding of the relationship between the actual hazard and subjective hazard perception of novice drivers, who have a higher number of traffic accidents compared to other types of drivers. Also, the study focuses on mountain roads that have a high workload when driving. Also, it shows an experiment in the Ecuadorian context, which considers the influence of the local culture. Finally, these results help focus the resources of public and private institutions and achieve better training in the hazard perception for novice drivers. Better-trained drivers will be less likely to be involved in a traffic accident, thus avoiding fatalities on the roads.
Acknowledgement
The authors acknowledge the support of the National Secretariat of Higher Education, Science, Technology and Innovation (SENESCYT) and Universidad Técnica Particular de Loja from the Republic of Ecuador
Referencias
- WHO, “Road traffic injuries,” Key facts, 2020. [Online]. Available: https://www.who.int/news-room/fact-sheets/detail/road-traffic-injuries. [Accessed: 17-Feb-2020].
- ANT, “Estadísticas sobre Siniestros de Tránsito,” Estadísticas de siniestros de tránsito - Agencia Nacional de Tránsito del Ecuador, 2020. [Online]. Available: https://www.ant.gob.ec/index.php/estadisticas. [Accessed: 17-Feb-2020].
- H. A. Deery, “Hazard and Risk Perception among Young Novice Drivers,” J. Safety Res., vol. 30, no. 4, pp. 225–236, 1999.
- S. Useche, A. Serge, and F. Alonso, “Risky Behaviors and Stress Indicators between Novice and Experienced Drivers,” Am. J. Appl. Psychol., vol. 3, no. 1, pp. 11–14, 2015.
- J. Hall and R. West, “Role of formal instruction and informal practice in learning to drive,” Ergonomics, vol. 39, no. 4, pp. 693–706, Mar. 1996.
- O. Oviedo-Trespalacios and B. Scott-Parker, “Fast and furious: A neglected issue in health promotion among young drivers,” Heal. Promot. J. Aust., vol. 30, pp. 1–6, Sep. 2018.
- A. Borowsky and T. Oron-Gilad, “Exploring the effects of driving experience on hazard awareness and risk perception via real-time hazard identification, hazard classification, and rating tasks,” Accid. Anal. Prev., vol. 59, pp. 548–565, 2013.
- K. L. Mills, H. R. D, M. McDonald, and G. Rolls, “The effects of hazard perception training on the developmentof novice driver skills,” 1996.
- Y. García Ramírez, B. Zárate, S. Segarra, and J. González, “Percepción de la seguridad vial en la Ciudad de Loja (Ecuador),” Cumbres, vol. 4, no. 1, pp. 89–100, 2018.
- G. Underwood, “Visual attention and the transition from novice to advanced driver,” Ergonomics, vol. 50, no. 8, pp. 1235–1249, Aug. 2007.
- T. S. A. Wallis and M. S. Horswill, “Using fuzzy signal detection theory to determine why experienced and trained drivers respond faster than novices in a hazard perception test,” Accid. Anal. Prev., vol. 39, no. 6, pp. 1177–1185, Nov. 2007.
- A. Pollatsek, V. Narayanaan, A. Pradhan, and D. L. Fisher, “Using eye movements to evaluate a PC-based risk awareness and perception training program on a driving simulator.,” Hum. Factors, vol. 48, no. 3, pp. 447–64, Sep. 2006.
- L. Huestegge, E. M. Skottke, S. Anders, J. Müsseler, and G. Debus, “The development of hazard perception: Dissociation of visual orientation and hazard processing,” Transp. Res. Part F Traffic Psychol. Behav., vol. 13, no. 1, pp. 1–8, Jan. 2010.
- F. P. McKenna, M. S. Horswill, and J. L. Alexander, “Does anticipation training affect drivers’ risk taking?,” J. Exp. Psychol. Appl., vol. 12, no. 1, pp. 1–10, Mar. 2006.
- H. v. Benda and C. G. Hoyos, “Estimating hazards in traffic situations,” Accid. Anal. Prev., vol. 15, no. 1, pp. 1–9, Feb. 1983.
- “iRAP - International Road Assessment Programme.” [Online]. Available: https://www.irap.org/. [Accessed: 02-Mar-2020].
- C. Moran, J. M. Bennett, and P. Prabhakharan, “Road user hazard perception tests: A systematic review of current methodologies,” Accid. Anal. Prev., vol. 129, pp. 309–333, Aug. 2019.
- Beca, “Actual and perceived risk and effects on driver behaviour report,” New Zealand, 2014.
- K. Pammer, A. Raineri, V. Beanland, J. Bell, and M. Borzycki, “Expert drivers are better than non-expert drivers at rejecting unimportant information in static driving scenes,” Transp. Res. Part F Traffic Psychol. Behav., vol. 59, pp. 389–400, Nov. 2018.
- P. Ventsislavova et al., “What happens when drivers face hazards on the road?,” Accid. Anal. Prev., vol. 91, pp. 43–54, Jun. 2016.
- D. Crundall et al., “Some hazards are more attractive than others: Drivers of varying experience respond differently to different types of hazard,” Accid. Anal. Prev., vol. 45, pp. 600–609, Mar. 2012.
- S. E. Lee et al., “Detection of road hazards by novice teen and experienced adult drivers,” Transp. Res. Rec., vol. 2078, no. 2078, pp. 26–32, 2008.
- Ministerio de Salud Pública, “Coronavirus COVID 19 – Ministerio de Salud Pública,” 2020. [Online]. Available: https://www.salud.gob.ec/coronavirus-covid-19/. [Accessed: 03-Jun-2020].
- Registro Oficial No. 336. Quito: Presidencia de la República del Ecuador, 2008.
- ANT, “Reglamento de escuelas de capacitación para conductores profesionales,” Resolución No 160-DIR-2013-ANT, 2013. [Online]. Available: https://www.ant.gob.ec/index.php/transito-7/resoluciones-2013/file/1947-resolucion-no-160-dir-2013-ant-reglamento-de-escuelas-de-capacitacion-para-conductores-profesionales. [Accessed: 04-Aug-2020].
- Google, “G Suite: Aplicaciones de colaboración y productividad para empresas,” 2020. [Online]. Available: https://gsuite.google.com/intl/es-419/. [Accessed: 14-Jul-2020].
- IRAP, “ViDA,” 2020. [Online]. Available: https://vida.irap.org/es/home. [Accessed: 04-Mar-2020].
- Y. D. García-Ramírez and F. Alverca, “Calibración de Ecuaciones de Velocidades de Operación en Carreteras Rurales Montañosas de Dos Carriles: Caso de Estudio Ecuatoriano,” Rev. Politécnica, vol. 43, no. 2, pp. 37–44, Jul. 2019.
- State College, “Minitab 14.2 Statistical Software [Computer program].” PA: Minitab, Inc., 2005