Videogame road scenes to measure hazard perception on experienced drivers
Escenas de carreteras videojuegos para medir la percepción del peligro en conductores experimentados
Artículos
Recibido: 07/08/2020
Aprobado: 30/04/2021
Autores
Yasmany García-Ramírez
Janina Tapia
Abstract
Experienced drivers develop the hazard perception skills with the driving practice. Hazard perception can be estimated using various methodologies such as photos, videos, simulators, or driving tests. Videogames increasingly are offering more realistic environments, and they are less expensive than simulators. Therefore, the study aimed to analyze the hazard perception of experienced drivers using road scenes from videogames. This perception was compared to the objective one provided by iRAP. As a result, experienced drivers underestimate the real danger in the most dangerous places, and overestimate them in the least dangerous sites. Given the trend between these two perceptions, it calibrated a linear regression equation. Also, the differences between the types of drivers' licenses were found in the sample. The results may help to propose specific training plans for these drivers to adjust their hazard perception with the actual one.
Resumen
Los conductores experimentados desarrollan habilidades de percepción del peligro con la práctica de conducción. La percepción del peligro se puede determinar usando diversas metodologías tales como fotos, videos, simuladores o recorridos reales. Los videojuegos cada vez más ofrecer entornos más realistas y es una alternativa menos cara que los simuladores. Por lo tanto, el estudio tuvo por objetivo analizar la percepción del peligro de conductores experimentados usando escenas de carreteras de los videojuegos. Esta percepción se comparó con la percepción objetiva provista por el iRAP. Como resultado los conductores experimentados subestiman el peligro real especialmente en los lugares más peligrosos y los sobreestiman en los sitios menos peligroso. Ante la tendencia entre estas dos percepciones, se calibró una ecuación de regresión lineal. También, se encontraron diferencias entre los tipos de licencia de los conductores de la muestra. Los resultados pueden servir para generar planes de formación específicos para estos conductores con el fin de ajustar la percepción del peligro con la percepción real.
1. Introduction
Worldwide die annually 1.35 million people and 50 million injured due to traffic accidents on roads [1]. One of the predominant factors in the vehicle-driver-road system is the human factor. Young novice drivers are overrepresented in road accidents than experienced and older road users [2], [3]. However, experienced drivers could also make mistakes, especially on mountain roads, due to the high demand for perceptual and cognitive skills.
An experienced driver has several skills that the novice driver does not or should develop through driving practice. For example, an experienced driver can predict risky situations faster than novices [4]. They have shorter reaction times than novice drivers [2]. Their perception skills are unaffected by slight increases in drowsiness, while inexperienced drivers decrease them dangerously [5]. That's why novice drivers are more involved in road accidents than experienced drivers. One possible factor that influences this relationship is the hazard perception [6] that has been found to correlate with crash risk [3], [5].
Hazard perception is the ability to anticipate potentially dangerous road and traffic situations [7]. That is, drivers, analyze the attributes of the road that can lead them to accidents or, in an accident, to increase its severity. For novice drivers, this perception improves with age and driving. And in the experienced ones, despite having better performance than the novice, it can still be improved. The hazard perception of experienced drivers could be considered underdeveloped, despite many hours behind the wheel [6]. For example, experienced drivers are significantly slower in perceiving danger than expert drivers (police drivers) [8]. Experienced drivers also benefit from brief hazard perception training [9]. And there is no evidence that the ability to perceive hazard among experienced drivers reaches an optimal level [10]. Given that hazard perception is a leading skill on the roads, various methodologies have been used to calculate it.
The hazard perception can be estimated using four methodologies: static image [11], videos [5], [6], driving simulators [12], and driving test [13]. Driving tests during COVID-19 restrictions [14] were impossible to carry out, so the simulated scenarios may be a possible alternative, even with budgetary limitations. Nowadays, scenarios in videogames are very realistic [15]. In general, in those methodologies, perception and reaction time has been used as the main parameter that correlates to the hazard perception. Another way is through surveys [16], where it investigates more deeply about the dangers that the driver reports. In any case, researchers directly or indirectly seek that the driver hazard perception matches the actual hazard perception.
The actual hazard perception or objective hazard is estimated from the relationship between various attributes of the road, its environment, and historical records of traffic accidents. iRAP methodology could be used to get this actual perception [17]. It assigns some stars (from 1 to 5) for motorized users (vehicle occupants and motorcyclists), cyclists, and pedestrians. The higher the number, the lower the risk, and there will be fewer crashes or injuries. This methodology is being used by various countries worldwide to improve road safety.
In this context, the objective of this article is to analyze the hazard perception of experienced drivers on mountain roads with scenes from videogames. The participant’s hazard perception was compared with the objective hazard perception of iRAP. This research helps to understand the relationship between hazard perception and the actual one. Also, it is justified, since the hazard perception results from other countries may not be transferable between nations due to differences in traffic culture and infrastructure [11]. To explain this relationship the rest of the article is organized as follows. First, it describes the used materials and methods. It details the driver and site selection. Besides, it shows the data collection and processing, and the employed equipment. Then the results of the experiment are explained. Finally, the main conclusions of the study are highlighted.
2. Materials and methods
One experiment was performed to determine each driver's hazard perception and compared them to the actual one. It employed full tours in simulated scenarios from a videogame. Driver hazard perception was estimated through a survey at each site. This survey included two questions: how dangerous is the site and why. The objective hazard was calculated using the iRAP methodology. The data were processed and compared with the subjective perception. This section details all of these elements.
2.1. Drivers selection
Participants in this study were experienced drivers (over two years of driving) from Ecuador. They used to drive frequently on roads, and they do not drive public transport vehicles. Previous similar studies had a sample between 19 and 25 drivers [3]. This research had thirty participants. They had an average of 11.1 ± 1.8 years of experience (95% CI) and an average age of 32.1 ± 2.1 years (95% CI). Most of the participants were male (27), and the rest were female. Thirteen people had a license driving type B, and 17 had a type C. The first license type is obtained in driving schools (short term) while the second is with formal education (long term). Both licenses driving allow driving private light vehicles, but type C could drive public transport vehicles.
2.2. Sites selection
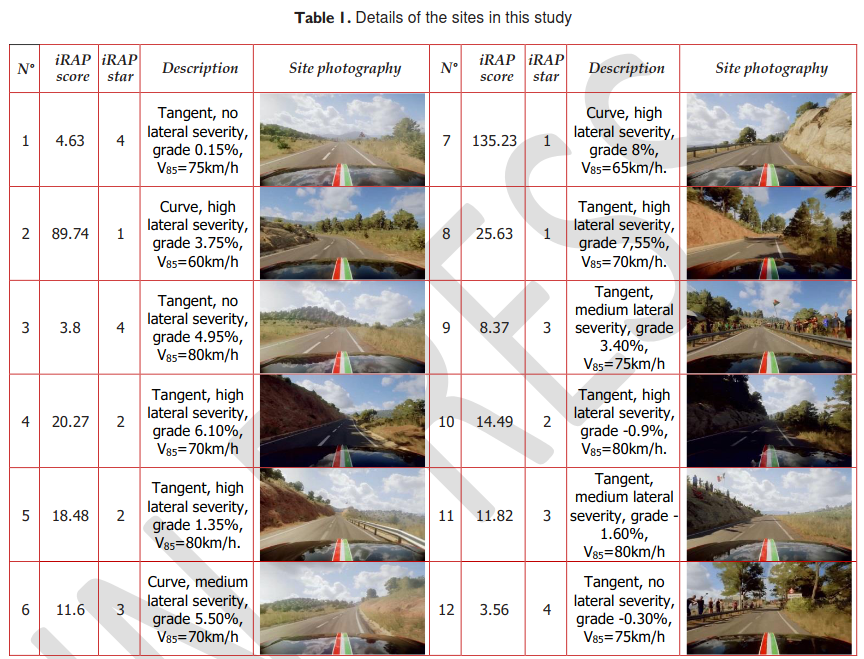
For this experiment, a simulated scenario was used from a videogame called DiRT Rally 2.0 [18]. In this videogame, it selected the study sites from the route T730 and T714 in Spain. This road was 11.60 km, it has two lanes, longitudinal slopes between -8.5% to 14.6%, typical features of mountain topography. It also has 130 horizontal curves with radii less than 300m. The speed limit was 90 km/h and the estimated traffic of 5300 vehicles/day. The details of the sites can be seen in table 1. Road scenarios had up to four stars since five stars are rare to find in the mountain road. For every star, it had three road scenes (1 to 4) to get better statistic results.
2.3. Equipment
Due to the COVID-19 restrictions, data was collected using digital platforms. The survey was performed in Google Forms [19] and shared it online with the participants. The survey had a prior validation process to avoid confusion or misinterpretation, as well as to test their operation. For the collecting data used the Zoom platform [20] to clear general aspects of the survey and to record answers.
Table 1
Details of the sites in this study
2.4. Data collection and processing
For data collection, every driver watched the videos of the 12 study sites. They were notified by countdown when they should start the evaluation. Participants watched the video (approximate average vehicle speed of 60 km/h) using the Zoom Platform. In every study site, they answered the survey. Answers were recorded using the same platform. The driver could not see again the site, which is similar in real driving. This survey had two questions: how dangerous do you think this site is? (1 = not dangerous at all, 10 = very dangerous), and why do you consider it this way? In the second question, the road features considered dangerous (if any) should be detailed.
It calculated the average of the hazard score (0-10). This score was scaled to a value up to 5 (1-5), to compare it to the stars given by iRAP. The online software called ViDA [21] was used to estimate the objective hazard. Some of the inputs, in this software, was calculated from previous studies; for example, the operating speed was estimated from calibrated equations in a mountain road [22]. On the other hand, it also recorded the road attributes that the driver mentioned in every scene. The detected attributes were compared to the ones in the iRAP. Based on these relationships, the results of the study are discussed.
3. Results
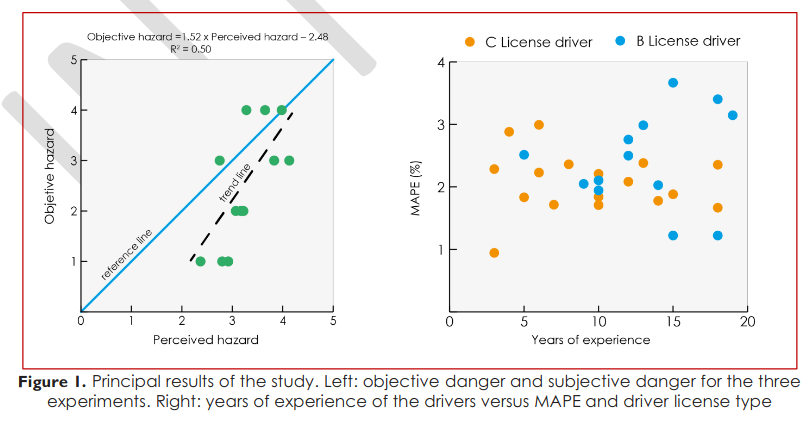
The principal results of the study are shown in figure 1. In the left of this figure, shows a scatter plot between perceived and objective hazard. Experienced drivers overestimate the danger on the road in scenarios with 1, 2 and some with 3 stars, while underestimate in some places with 4 stars. Therefore, it is not surprising that the principal cause of road accidents in the country is due to the driver's negligence [23]. From this trend, it calibrated a linear equation (1) with an R2 of 0.50. This equation shows a positive relationship between the two dangers, but with a steeper slope. This equation predicts the actual hazard (calculated with the iRAP methodology) based on the experienced driver hazard perception. This equation cannot be used beyond the range of this investigation since it can generate inconsistent values. Other previous study did not find significant relationships between self-ratings and objective measures of hazard perception ability [6].
In the right of figure 1, it plotted the years of experience with the Mean Absolute Percentage Error (MAPE) and the driver licenses type. Experienced drivers had type B and C driver licenses. It calculated MAPE to analyze any difference between them and their answers. This error is based on both objective and subjective hazard in the twelve scenarios. First, it can be seen that drivers with a Type C license have higher errors in the hazard estimates, but they decrease slightly as the years of experience increase. Drivers with a Type B license have few mistakes at the beginning and increases with years of experience. This difference is possibly due to the training that individuals have, which in the first case is full curriculum, and in the second one just few courses. However, at some point, they should converge because, with more kilometers traveled per year, drivers could perceive the hazard better. It may happen after 20 years of experience, and it should analyze in future research
Figure 1
Principal results of the study. Left: objective danger and subjective danger for the three experiments. Right: years of experience of the drivers versus MAPE and driver license type
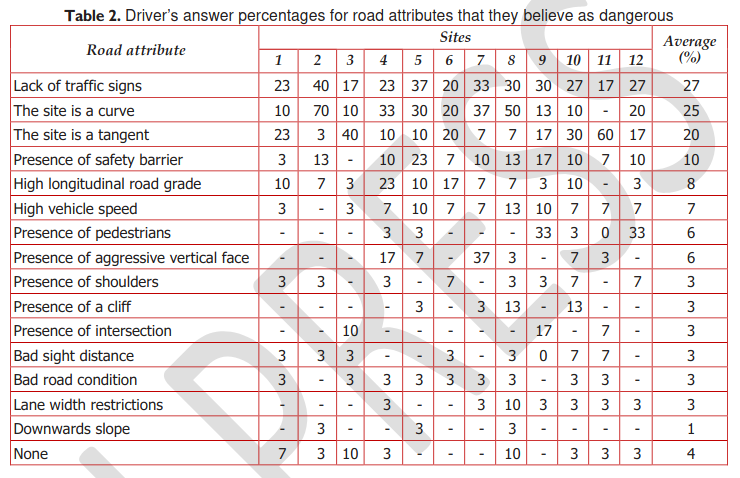
On the other hand, the attributes of the road that the participants considered dangerous are detailed in Table 2. The average of the twelve analyzed sites also was placed in that table. Based on this average, drivers generally recognize the lack of traffic signs and other noticeable conditions such as a horizontal curve or a tangent. Although these three attributes can lead to a road accident, drivers do not perceive the rest of them that can also cause serious injuries such as lack of visibility or the presence of a cliff. Then, it could be concluded that drivers focus more on attributes that can lead to an accident and not based on the severity, so it is evident that more training in this topic is necessary.
Table 2
Driver’s answer percentages for road attributes that they believe as dangerous
4. Conclusions
This paper aims to analyze the hazard perception of experienced drivers using road scenes from videogames. Thirty experienced drivers participated in the experiment. Videogame road scenes were shown using the Zoom platform. After collecting and processing data, this final section presents the principal conclusions.
The main finding is that the hazard perception diverges from the actual hazard in most of the analyzed sites. Sites with higher objective hazards (1 or 2 stars) are perceived as less dangerous by experienced drivers. This condition represents a permanent risk since they underestimate the danger in those risky places. Furthermore, it is worrying that experienced drivers cannot adequately detect the hazard, which shows weakness in the driver training system regarding this topic. The same conclusion can be reached if the types of driver licenses, age, and the error in estimating the hazard (MAPE) are analyzed. Also, it found that the main road attributes are related to the probability of a crash accident, but not to its severity. These results, despite being revealing, represent an opportunity, since specific courses on the subject can be created to fill those gaps.
On the other hand, the work also selected realistic videogame road scenes, which can be used to analyze hazard perception. Nowadays, graphics have very realistic environments, especially when they do not include people. Its high level of detail, its colors, its transitions, etc. allows for accurately illustrating a site, such as a highway. Second, videogames generally employ real roads in their simulated scenarios, allowing data to be collected to estimate their objective hazard. Data could be related to traffic, speed of operation, lane width, etc. Finally, it is less expensive than the driving simulator, since the driver does not need to maneuver the simulator vehicle, but they need to watch the videos. Also, they are cheaper than real trips, and the driver has no risk of getting involved in a traffic accident.
This study has several limitations. The study analyzed only experienced drivers who differ from other drivers. There were few female drivers in the participants. And the sample was only 30 participants. Despite these limitations, this research shows the relationship between perceived hazard and actual hazard. It fitted a linear equation with this trend. This study represents a local study of hazard perception, which had not been previously studied. Furthermore, the results are applied to the mountain roads that have a higher demand from drivers than other roads. Finally, the results of this study can be used by driver training institutions and institutions that are responsible for reducing traffic accidents.
Acknowledgement
The authors acknowledge the support of the National Secretariat of Higher Education, Science, Technology and Innovation (SENESCYT) and Universidad Técnica Particular de Loja from the Republic of Ecuador.
Referencias
- WHO, “Road traffic injuries,” Key facts, 2020. [Online]. Available: https://www.who.int/news-room/fact-sheets/detail/road-traffic-injuries. [Accessed: 17-Feb-2020].
- H. A. Deery, “Hazard and Risk Perception among Young Novice Drivers,” J. Safety Res., vol. 30, no. 4, pp. 225–236, 1999.
- C. Moran, J. M. Bennett, and P. Prabhakharan, “Road user hazard perception tests: A systematic review of current methodologies,” Accid. Anal. Prev., vol. 129, pp. 309–333, Aug. 2019.
- D. Crundall, “Hazard prediction discriminates between novice and experienced drivers,” Accid. Anal. Prev., vol. 86, pp. 47–58, Jan. 2016.
- S. S. Smith, M. S. Horswill, B. Chambers, and M. Wetton, “Hazard perception in novice and experienced drivers: The effects of sleepiness,” Accid. Anal. Prev., vol. 41, no. 4, pp. 729–733, Jul. 2009.
- M. S. Horswill, K. Taylor, S. Newnam, M. Wetton, and A. Hill, “Even highly experienced drivers benefit from a brief hazard perception training intervention,” Accid. Anal. Prev., vol. 52, pp. 100–110, Mar. 2013.
- M. S. Horswill and F. P. McKenna, “Drivers’ hazard perception ability: Situation awareness on the road,” in A Cognitive Approach to Situation Awareness, Ashgate, 2004, pp. 155–175.
- F. P. McKenna and J. L. Crick, “Hazard perception in drivers: a methodology for testing and training | TRL,” Jan. 1994.
- M. S. Horswill, C. N. Kemala, M. Wetton, C. T. Scialfa, and N. A. Pachana, “Improving older drivers’ hazard perception ability,” Psychol. Aging, vol. 25, no. 2, pp. 464–469, Jun. 2010.
- M. A. Wetton, A. Hill, and M. S. Horswill, “The development and validation of a hazard perception test for use in driver licensing,” Accid. Anal. Prev., vol. 43, no. 5, pp. 1759–1770, Sep. 2011.
- V. Tūskė, L. Šeibokaitė, A. Endriulaitienė, and E. Lehtonen, “Hazard perception test development for Lithuanian drivers,” IATSS Res., vol. 43, no. 2, pp. 108–113, Jul. 2019.
- S. Bromberg, T. Oron-Gilad, A. Ronen, A. Borowsky, and Y. Parmet, “The perception of pedestrians from the perspective of elderly experienced and experienced drivers,” Accid. Anal. Prev., vol. 44, no. 1, pp. 48–55, Jan. 2012.
- S. E. Lee et al., “Detection of road hazards by novice teen and experienced adult drivers,” Transp. Res. Rec., vol. 2078, no. 2078, pp. 26–32, 2008.
- OMS, “Coronavirus - Overview,” 2020. [Online]. Available: https://www.who.int/health-topics/coronavirus#tab=tab_1. [Accessed: 07-Jun-2020].
- J. Petit and O. Brémond, “Interactive high dynamic range rendering for virtual reality applications,” in Proceedings of the ACM Symposium on Virtual Reality Software and Technology, VRST, 2009, pp. 251–252.
- Beca, “Actual and perceived risk and effects on driver behaviour report,” New Zealand, 2014.
- “iRAP - International Road Assessment Programme.” [Online]. Available: https://www.irap.org/. [Accessed: 02-Mar-2020].
- “DiRT Rally (2.0).” Codemasters Franchise [Computer game], 2019.
- Google, “G Suite: Aplicaciones de colaboración y productividad para empresas,” 2020. [Online]. Available: https://gsuite.google.com/intl/es-419/. [Accessed: 14-Jul-2020].
- Zoom Video Comunications Inc., “Zoom Video Comunications.” 2020.
- ChinaRAP, “ViDA,” 2020. [Online]. Available: https://vida.irap.org/es. [Accessed: 14-Jul-2020].
- Y. D. García-Ramírez and F. Alverca, “Calibración de Ecuaciones de Velocidades de Operación en Carreteras Rurales Montañosas de Dos Carriles: Caso de Estudio Ecuatoriano,” Rev. Politécnica, vol. 43, no. 2, pp. 37–44, Jul. 2019.
- ANT, “Estadísticas sobre Siniestros de Tránsito,” Estadísticas de siniestros de tránsito - Agencia Nacional de Tránsito del Ecuador, 2020. [Online]. Available: https://www.ant.gob.ec/index.php/estadisticas. [Accessed: 17-Feb-2020]